Ships, Roads, and Mushrooms: How I Harnessed the Power of Automation
A veteran intern at SkyTruth ups her coding skills to preserve the planet
Machine learning is a powerful tool that SkyTruth employs for a wide variety of conservation goals, from detecting roads to scoping out oil pollution at sea. As a former geology major, I jumped at the chance to leverage computer science skills to promote conservation in this way by applying to be a SkyTruth intern.
Within a month of beginning my internship, I began to understand the capabilities of machine learning thanks to the help of Jona Raphael, SkyTruth’s Machine Learning Engineer. He suggested that I delve into Fast.ai’s Practical Deep Learning for Coders course, which challenged me to create an image classification machine learning model. My lifelong fascination with fungi made it easy to choose which images to identify:
Morel mushrooms.
Wild morel mushrooms are highly foraged each year for their distinctive taste. However, they can be confused by amateur morel hunters with their potentially deadly doppelgänger, the false morel. What better reason to classify images than defending against killer mushrooms?
To create a model that could differentiate between true and false morels, I developed a script in Python—a coding language used in machine learning—to grab various images of both mushrooms from the internet. From those data, I trained a machine learning model, drawing on Fast.ai’s deep learning library, a resource for training image classification models.

True morel (left) and false morel (right). Credit: (left image) Scott Hecker/flickr CC BY 2.0; (right image) Alan Rockefeller/Wikimedia CC BY-SA 4.0
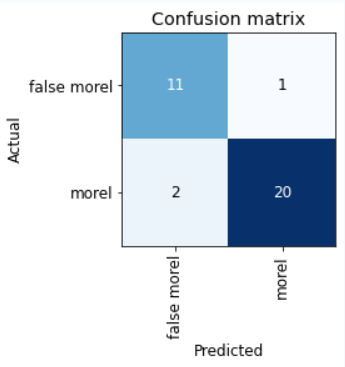
After retraining the machine learning model several times to improve its performance, I generated an accuracy rate of 91.2% and an error rate of 8.8%. Because the sample size of images was small, the model performed admirably—but training on a larger number of images would improve our confidence in the model.
From Toadstools to Oceans
With this project under my belt, I was ready to explore automation techniques for the sake of conservation.
I approached SkyTruth’s Software Engineer Dan Cogswell, who introduced me to something completely foreign and slightly intimidating: web scraping.
Web scraping is the practice of automating data collection from a website using a script. Imagine the tedious process of clicking buttons on a website to copy and paste text into Excel, except rather than a person performing these actions, a computer does all the work itself—that’s essentially web scraping.
By inspecting a website’s frontend data (i.e., the visible part of the website that the user sees, which is typically composed of HTML/CSS and JavaScript code) and feeding these data into a script, you can write a program that mimics the actions of a human. This handy shortcut automates tasks that would take hours to do manually.
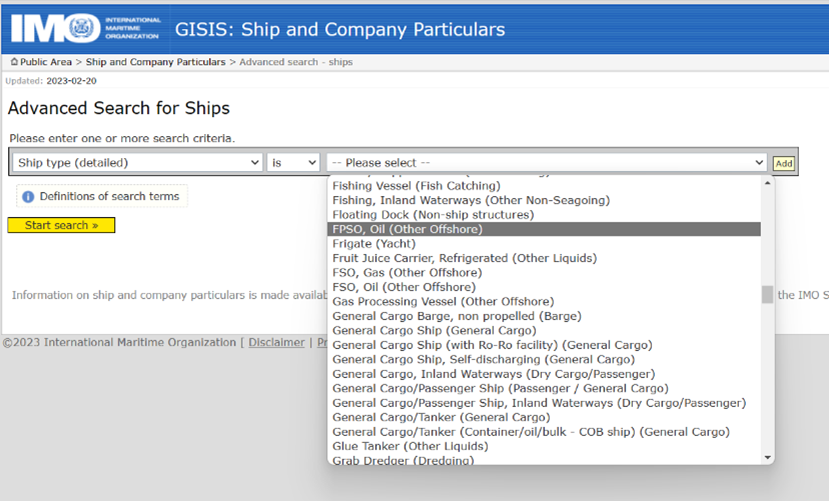
Manually selecting the FPSO ship type from the drop-down menu (top) can be automated using Python code (bottom).
Using this web scraping technique, Dan asked me to collect data on a vast number of ships from the International Maritime Organization’s (IMO) website, specifically Floating Production, Storage, and Offloading vessels (FPSOs) and Floating Storage and Offloading vessels (FSOs). FPSOs and FSOs are used for the processing, storage, and transfer of oil and gas in connection to offshore drilling operations.
Due to the potentially high oil pollution risks posed by these vessels, it is imperative that they are well monitored. Unfortunately, there are currently no publicly available lists of all FPSOs and FSOs in operation, which makes monitoring these vessels difficult. SkyTruth wants to change that—and I get to help.
Using Python and the Selenium automation library, I wrote a script to enter criteria for the ships of interest, retrieve approximately 40 pages of search results, and then collect detailed information for every ship listed on each page. In total, the web scraper collected data for 570 FPSOs and FSOs from the IMO website. A major effort at SkyTruth is creating and publishing a list of all FPSOs and FSOs currently in operation, a huge undertaking that automation techniques can make far more efficient.
This project was extremely valuable to the development of my automation skills. However, it was only the beginning of my automation journey, as I was now ready for another challenging task: GIS automation.
Hitting the Road With Satellites
When I took my introductory GIS classes as an undergraduate, I remember creating a lot of maps in ArcMap—software used for mapping and spatial data analysis—and most of all, clicking a lot of buttons and waiting for things to load. No programming was taught in these courses, so I never knew that there was a less menial method to accomplish these tasks. SkyTruth completely changed that.
SkyTruth’s Geospatial Engineer Christian Thomas is behind our great effort to map the coal mining extent in Central Appalachia. When he approached me about writing an automation script to create SkyTruth’s annual mountaintop mining mask, which is typically done manually using the mapping software QGIS, I had two hills I needed to climb: First, I needed to understand what a mountaintop mining mask is, and second, I needed to figure out how I could automate its creation.
Part of this mapping process includes creating a mountaintop mining mask that “masks out” areas unlikely to be mines, such as roads, water bodies, and urban areas, thus excluding these areas from analysis. While this mask can be created manually in QGIS, the process can be long and tedious, and it needs to be recreated every year. Thankfully, the mask creation can be easily automated.
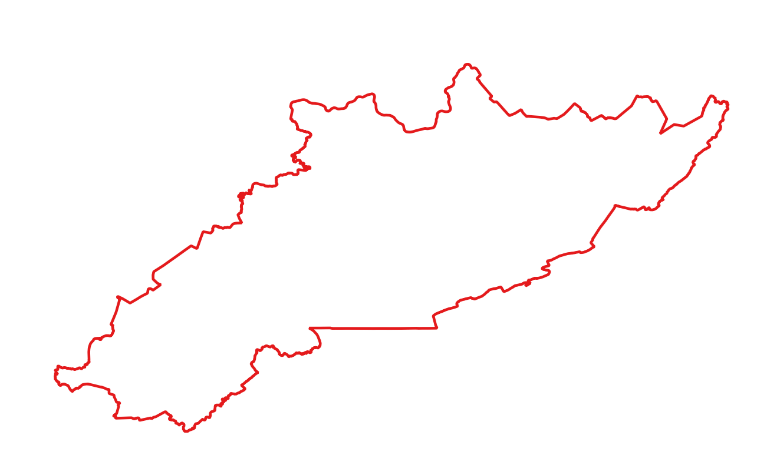
To begin creating the mask, I first downloaded the study area boundary from SkyTruth’s website. The study area comprises 75 counties across Kentucky, Tennessee, Virginia, and West Virginia.
Next, I downloaded the road and hydrographic data associated with each county from the US Census Bureau website. These data would be masked out from the study area, since mines are unlikely to be located on roads and bodies of water.
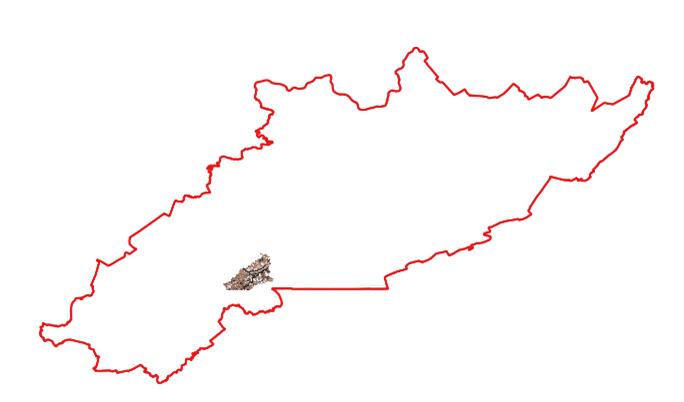
Hydrography is split into two separate datasets: area hydrography, which includes water bodies such as lakes and ponds, and linear hydrography, which includes water bodies such as rivers and streams. Therefore, each county within the study area has three separate datasets: one road dataset and two hydrographic datasets. For instance, if we display the datasets for Bell County, Kentucky, within the study area, three superimposed datasets look like a small puzzle piece within the large study area. As SkyTruth continues to download datasets for the study area, the puzzle is becoming more and more complete.
Once the datasets were downloaded for each county, the data was reprojected to the correct coordinate system and merged. Merging the datasets can be thought of as gluing the puzzle pieces together. For ease, I decided to merge each dataset separately, fusing together all of the road data, all of the area hydrography data, and all of the linear hydrography data. The result: three separate massive datasets.
Next, I buffered all three datasets by 60 meters. Buffering the data enlarges it, increasing the area that will be excluded as a mine. Again, this helps exclude roads and bodies of water.
After that, I began processing the last piece of geographic data needed to complete the mask: urban areas.
Unlike roads and hydrography, the urban areas dataset is downloaded as a national dataset from the US Census Bureau website. However, to focus on urban areas within the study area, I had to “clip” the national urban areas data and match them to our much smaller study area. Think of the national urban areas dataset as a large cookie and the study area as a cookie cutter. By overlaying the study area onto the urban areas dataset, I could cut out the small subsection of urban areas data that I needed for the mask.
Once I finished reprojecting and buffering the urban areas dataset, I merged the four separate datasets—roads, area hydrography, linear hydrography, and urban areas—then merged them into one large dataset.
The very last step was to rasterize the shapefile. A shapefile is composed of vector data, such as points and lines, whereas raster data are composed of pixels. Rasterizing the shapefile yields an image that can be used for the mountaintop mining study area.
Every year, when it’s time for a new mask to be created, this automated Python script reduces an hour (or more) of work to the click of a button.
With these projects, SkyTruth has granted me a unique opportunity to become a better programmer while also positively impacting the environment; for that, I am eternally grateful. I’m certain that the work I’ve done here will reverberate throughout the rest of my career.
At SkyTruth, I have finally found my niche at the intersection of geology and computer science, in which I can yield programming as a powerful tool for solving diverse geospatial problems.


