What’s In the Water? An Analysis of Harmful Algal Blooms Using Remote Sensing
SkyTruth worked with researchers at Kent State University to detect toxic algal blooms quickly and easily from space using Google Earth Engine.
A few weeks ago, SkyTruth co-hosted a virtual meetup at Google’s Geo for Good Summit with our partners at Kent State University (KSU) to present our work identifying harmful algal blooms (HABs) using Google Earth Engine and satellite imagery. In this post, I’ll share how we made detecting HABs quicker, easier, and more accessible to others concerned about this growing problem.
HABs are becoming an increasingly regular occurrence across the United States and the globe, popping up with alarming frequency in lakes and coastal regions. Algae as a group of organisms are not innately dangerous; in fact, they are critical to most aquatic ecosystems for their role in the food web. However, when algae begin to proliferate too quickly, they can pose several problems. Not only can they produce toxins which are harmful to humans and pets, but they can contribute to hypoxic zones in water bodies (areas with no oxygen) which can kill marine life. Furthermore, if they produce a thick enough sheen on the surface of the water, they can blot out sunlight, depriving aquatic plants that live underwater of the sunlight they need to survive. HABs also affect local economies, as they deter fishing, recreational activities, and tourism.
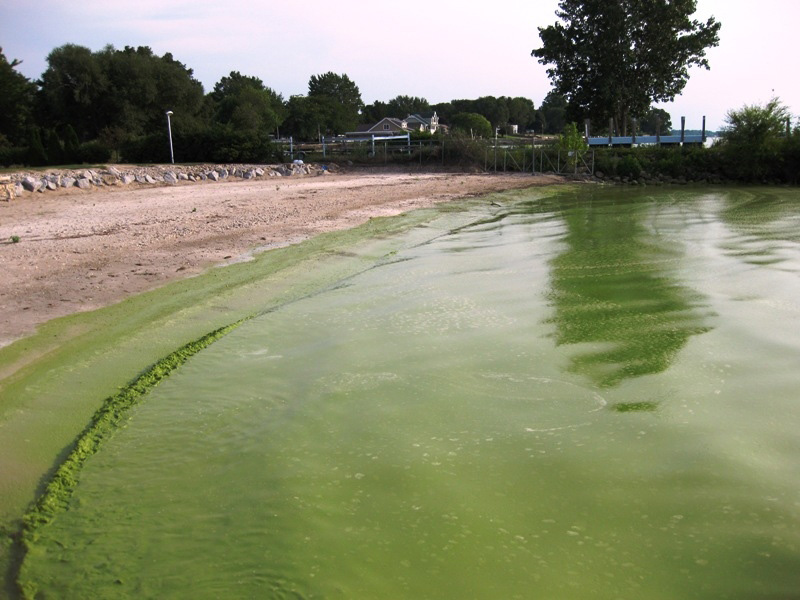
A cyanobacteria bloom on Lake Erie in 2009. Photo courtesy NOAA.
The rising frequency of HABs, unsurprisingly, is linked to human activities. HABs generally require a few conditions to get really out of hand: warm water, increased nutrient loading, and low flow rates. Rising global temperatures attributed to climate change, and thermal pollution from power plants releasing warm water into nearby water basins, increase water temperature. Nutrient wastes from agricultural, residential, and urban runoff (namely phosphorus and nitrogen from fertilizer and human and animal waste) are also ever increasing. This combination of conditions means that HABs may be an increasingly common indicator of poor water quality for years to come.

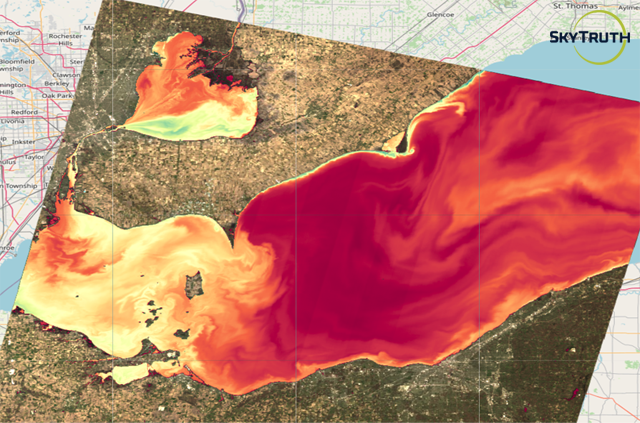
A real color image of Lake Maracaibo, Venezuela. Suspended oil, sediment, and potential blooms can be seen.
Dr. Joseph Ortiz, Professor of Geology at KSU, is working with SkyTruth to reduce the harm caused by HABs using an eye-from-the-sky to identify them and alert you before they can harm you, your family, or your local water system. Dr. Ortiz has developed a workflow which pulls HAB signals from a satellite image using a process known as spectral decomposition. This method extracts the maximum amount of linearly independent information from water pixels in an image, enabling identification of various divisions of algae, cyanobacteria, suspended sediment, and pigment degradation products. He does this using what’s known as a Varimax-Rotated Principal Component Analysis. Principal Component Analysis is an effective way to do what’s known as dimensionality reduction: we take a complex dataset and reduce it to only its most important variables. Varimax rotation of the derived components literally maximizes the variance between the components, making relationships and correlations more easily interpretable. In the case of a satellite image, we take all of its “variables” (that is, its captured bands of light) and parse out the wavelengths of light that contribute the most to the variance occurring over the surface. Using these principal components, coupled with lab verified indicators for which wavelengths of light certain algae tend to reflect, we can identify exactly which types of algae are present at any given time.

Three of the principal component results. Notice the different areas shown in blue between the components. According to Dr. Ortiz, the blue area in VPC #1 likely represents green algae, in the second component blue likely represents diatoms, and in the third component blue likely shows cyanobacteria.
Our approach provides added value over other approaches in the field, such as the National Oceanic and Atmospheric Administration’s (NOAA) Cyanobacteria Index, because we are able to break down the composition of the water with greater specificity. NOAA’s approach can, at times, lump in signal from other in-water constituents as “cyanobacteria.” In contrast, our approach with KSU more clearly distinguishes components, making it easier to detect problem areas. Knowing the locations of these blooms can, if deployed at a quicker time scale, provide useful feedback for boots-on-the-ground who may be able to respond to these blooms and warn communities before people or pets are harmed. Their effort will be more targeted and less general as a result.
Timeliness is key: previously, KSU would run its analysis by downloading imagery and analyzing it locally on a desktop computer. In order to create a system which runs in near real-time, allowing us to alert authorities as blooms form, it became necessary to move this analysis to the cloud. This is where SkyTruth comes in. Using Google Earth Engine, a favorite tool of ours, we were able to take the existing code written by Dr. Ortiz’s team in a specialized image processing language, translate it into Python, and move it into a platform which is optimized for the cloud. This offers the analysis a few important advantages. First, Earth Engine is an open source product. Up to this point, the spectral decomposition method used to analyze imagery for algae has been applied in proprietary software developed by Harris Geospatial called Envi and IDL. Earth Engine allows us to eventually make the code accessible to the entire remote sensing community to read, interpret, and, if they’re interested, contribute to.
Second, because all analysis run in Earth Engine takes place in the cloud we can run the decomposition on several images at a time in a matter of seconds! This makes the workflow a lot more viable for near real-time use, because Earth Engine houses an ever expanding repository of imagery that is available to us at the push of a button. This is the last and, frankly, the most important advantage of Earth Engine. Vast quantities of image data are all available from Google’s servers on demand whenever you need them. Utilizing all of these advanced features will go a long way to making this into an automated process capable of reaching people on the ground at lightning speed.
We are happy to say that we now have the process up and running reliably on Earth Engine using the programming language Python and imagery collected by the Landsat 8 satellite. Next steps for this project include branching to different satellite constellations (such as Sentinel-2, Sentinel-3, VIIRS), running the analysis over a collection of images all at once as opposed to one at a time, and creating a forward facing real-time notification platform to keep you up to date with the current status of your local lake, bay, or coastal area. This is just one of the ways in which SkyTruth is aiding researchers in their pursuit of solutions which will make the Earth a safer and more sustainable place to live for years to come.
At this year’s Geo for Good Summit, we spoke about our method and also heard about other projects from industry experts. If you are interested in viewing the presentation, follow the link here. If you’re interested in learning more about the project or getting under the hood of the analysis, please feel free to reach out to me at brendan@skytruth.org.

The panelists from our virtual meetup at the Geo for Good Summit!

