The trends aren’t encouraging: Industrialization, urban development, deforestation, overfishing, mining and pollution are accelerating the rate of global warming and damaging ecosystems around the world. The pace of environmental destruction has never been as great as it is today. Despite this grim assessment, I believe there’s reason to be hopeful for a brighter future.
I’m optimistic because of a new and powerful conservation opportunity: the explosion of satellite and computing technology that now allows us to see what’s happening on the ground and on the water, everywhere, in near real-time.
Up until now we’ve been inspiring people to take action by using satellites to show them what’s already happened to the environment, typically months or even years ago. But technology has evolved dramatically since I started SkyTruth, and today we can show people what’s happening right now, making it possible to take action that can minimize or even stop environmental damage before it occurs. For example, one company, Planet, now has enough satellites in orbit to collect high-resolution imagery of all of the land area on Earth every day. Other companies and governments are building and launching fleets of satellites that promise to multiply and diversify the stream of daily imagery, including radar satellites that operate night and day and can see through clouds, smoke and haze.
Just a few of the Earth-observation satellites in orbit. Image courtesy NASA.
The environmental monitoring potential of all this new hardware is thrilling to our team here at SkyTruth, but it also presents a major challenge: it simply isn’t practical to hire an army of skilled analysts to look at all of these images, just to identify the manageable few that contain useful information.
Artificial intelligence is the key to unlocking the conservation power of this ever-increasing torrent of imagery.
Taking advantage of the same machine-learning technology Facebook uses to detect and tag your face in a friend’s vacation photo, we are training computers to analyze satellite images and detect features of interest in the environment: a road being built in a protected area, logging encroaching on a popular recreation area, a mining operation growing beyond its permit boundary, and other landscape and habitat alterations that indicate an imminent threat to biodiversity, ecosystem integrity, and human health. By applying this intelligence to daily satellite imagery, we can make it possible to detect changes happening in the environment in near real-time. Then we can immediately alert anyone who wants to know about it, so they can take action if warranted: to investigate, to document, to intervene.
We call this program Conservation Vision.
And by leveraging our unique ability to connect technology and data providers, world-class researchers and high-impact conservation partners, we’re starting to catalyze action and policy success on the ground.
We’re motivated to build this approach to make environmental information available to people who are ready and able to take action. We’ve demonstrated our ability to do this through our partnership with Google and Oceana with the launch and rapid growth of Global Fishing Watch, and we’re already getting positive results automating the detection of fracking sites around the world. We have the technology. We have the expertise. We have the track record of innovation for conservation. And we’ve already begun the work.
Stay tuned for more updates and insights on how you can be part of this cutting-edge tool for conservation.
Fossil fuel production has left a lasting imprint on the landscapes and communities of central and northern Appalachia. Mountaintop mining operations, pipeline right-of-ways, oil and gas well pads, and hydraulic fracturing wastewater retention ponds dot the landscapes of West Virginia and Pennsylvania. And although advocacy groups have made progress pressuring regulated industries and state agencies for greater transparency, many communities in central and northern Appalachia are unaware of, or unclear about, the extent of human health risks that they face from exposure to these facilities.
A key challenge is the discrepancy that often exists between what is on paper and what is on the landscape. It takes time, money, and staff (three rarities for state agencies always under pressure to do more with less) to map energy infrastructure, and to keep those records updated and accessible for the public. But with advancements in deep learning, and with the increasing amount of satellite imagery available from governments and commercial providers, it might be possible to track the expansion of energy infrastructure—as well as the public health risks that accompany it—in near real-time.
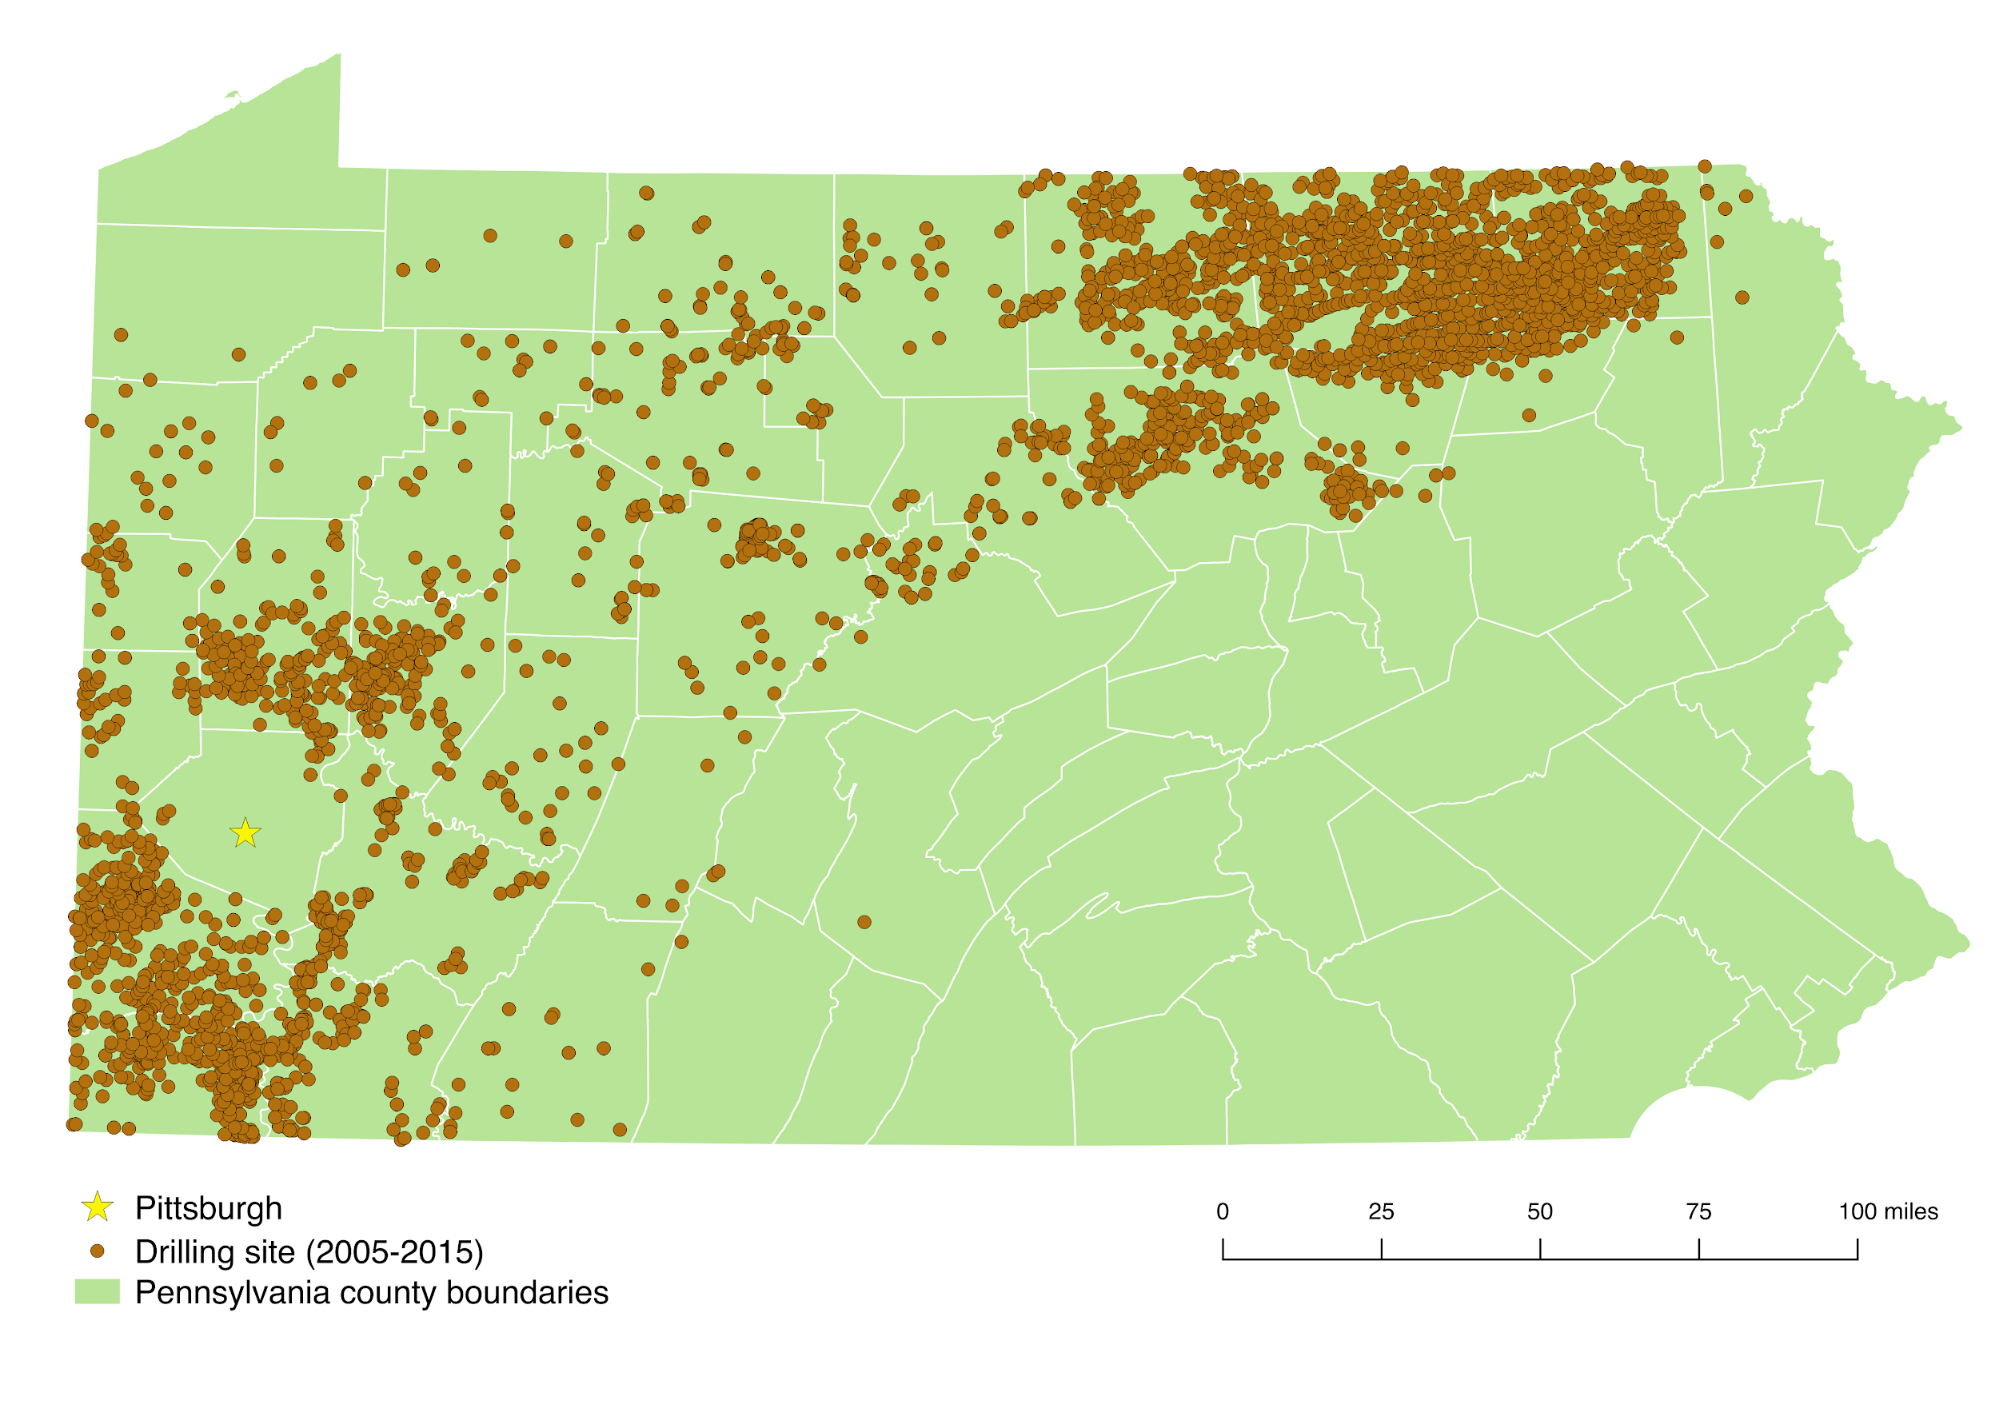
Figure 1. Oil and gas well pad locations, 2005 – 2015.
Mapping the footprint of oil and gas drilling, especially unconventional drilling or “fracking,” is a critical piece of SkyTruth’s work. Since 2013, we’ve conducted collaborative image analysis projects called “FrackFinder” to fill the gaps in publicly available information about the location of fracking operations in the Marcellus and Utica Shale. In the past, we relied on several hundred volunteers to identify and map oil and gas well pads throughout Ohio, Pennsylvania, and West Virginia. But we’ve been working on a new approach: automating the detection of oil and gas well pads with machine learning. Rather than train several hundred volunteers to identify well pads in satellite imagery, we developed a machine learning model that could be deployed across thousands of computers simultaneously. Machine learning is at the heart of today’s companies. It’s the technology that enables Netflix to recommend new shows that you might like, or that allows digital assistants like Google, Siri, or Alexa to understand requests like, “Hey Google, text Mom I’ll be there in 20 minutes.”
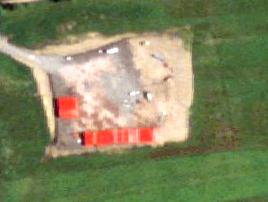
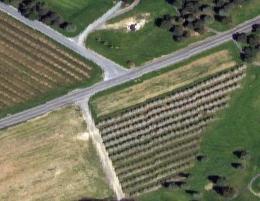
Examples are at the core of machine learning. Rather than try to “hard code” all of the characteristics that define a modern well pad (they are generally square, generally gravel, and generally littered with industrial equipment), we teach computers what they look like by using examples. Lots of examples. Like, thousands or even millions of them, if we can find them. It’s just like with humans: the more examples of something that you see, the easier it is to recognize that thing later. So, where did we get a few thousand images of well pads in Pennsylvania?
We started with SkyTruth’s Pennsylvania oil and gas well pad dataset. The dataset contains well pad locations identified in National Agriculture Imagery Program (NAIP) aerial imagery from 2005, 2008, 2010, 2013, and 2015 (Figure 1). We uploaded this dataset to Google Earth Engine, and used it to create a collection of 10,000 aerial images in two classes: “well pad” and “non-well pad.” We created the training images by buffering each well pad by 100 meters, clipping the NAIP imagery to the bounding box, and exporting each image.
The images above show three training examples from our “well pad” class. The images below show three training examples taken from our “non-well pad” class.
We divided the dataset into three subsets: a training set with 4,000 images of each class, a validation set with 500 images of each class, and a test set with 500 images of each class. We combined this work in Google Earth Engine with Google’s powerful TensorFlow deep learning library. We used our 8,000 training images (4,000 from each class, remember) and TensorFlow’s high-level Keras API to train our machine learning model. So what, exactly, does that mean? Well, basically, it means that we showed the model thousands and thousands of examples of what well pads are (i.e., images from our “well pad” class) and what well pads aren’t (i.e., images from our “non-well pad” class). We trained the model for twenty epochs, meaning that we showed the model the entire training set (8,000 images, remember) twenty times. So, basically, the model saw 160,000 examples, and over time, it “learned” what well pads look like.
Our best model run returned an accuracy of 84%, precision and recall measures of 87% and 81%, respectively, and a false positive rate and false negative rate of 0.116 and 0.193, respectively. We’ve been pleased with our initial model runs, but there is plenty of room for improvement. We started with the VGG16 model architecture that comes prepackaged with Keras (Simonyan and Zisserman 2014, Chollet 2018). The VGG16 model architecture is no longer state-of-the-art, but it is easy to understand, and it was a great place to begin.
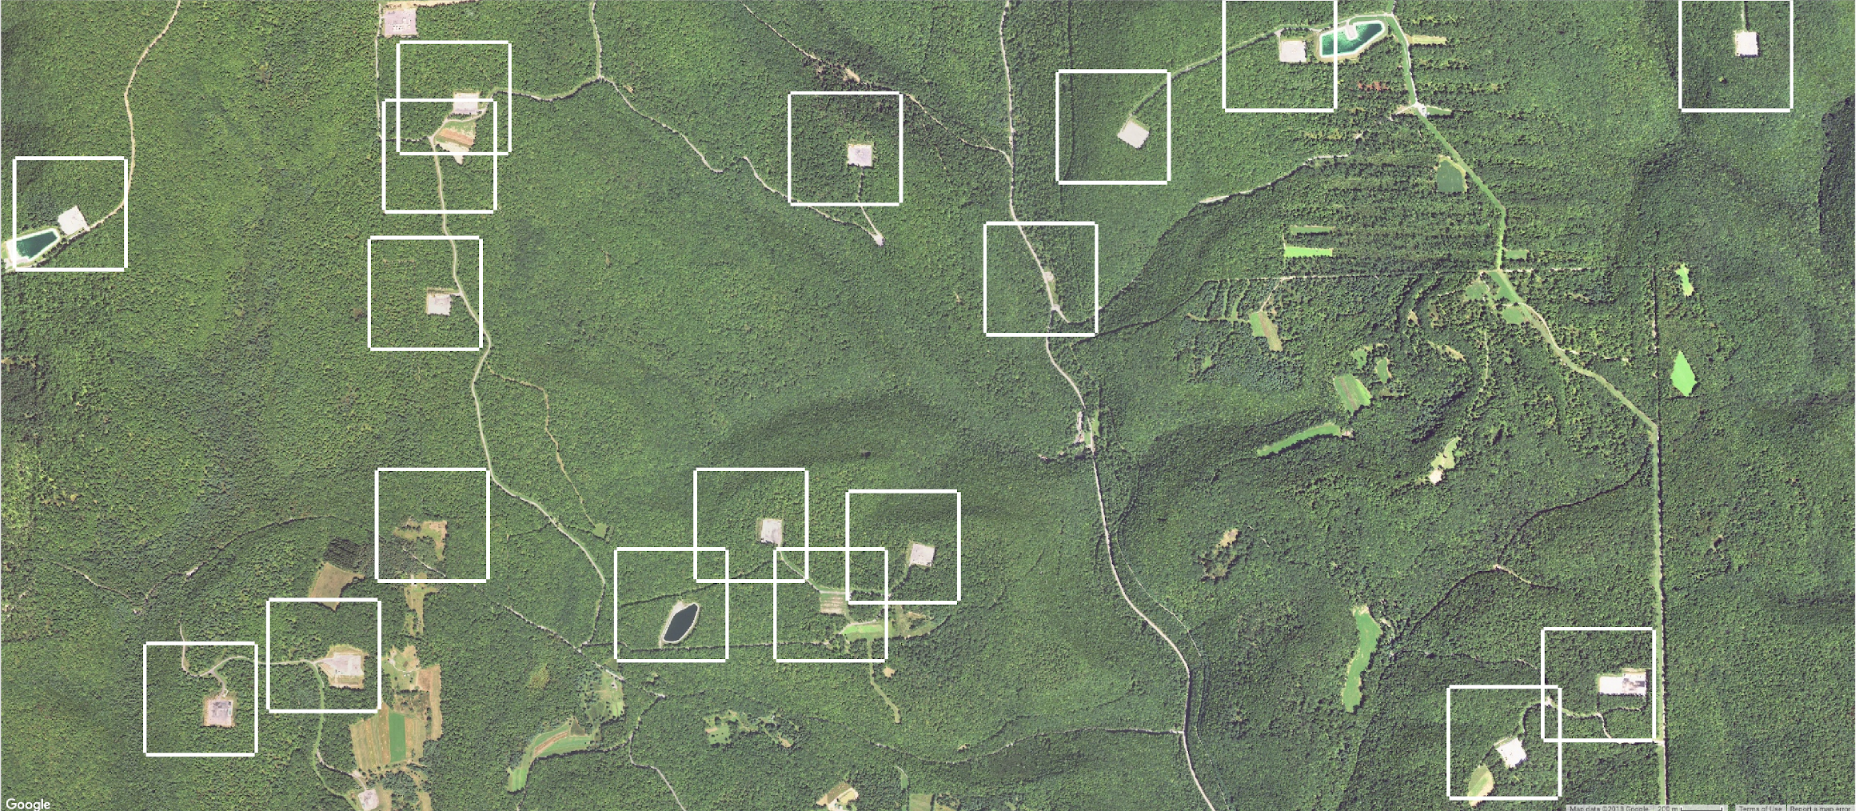
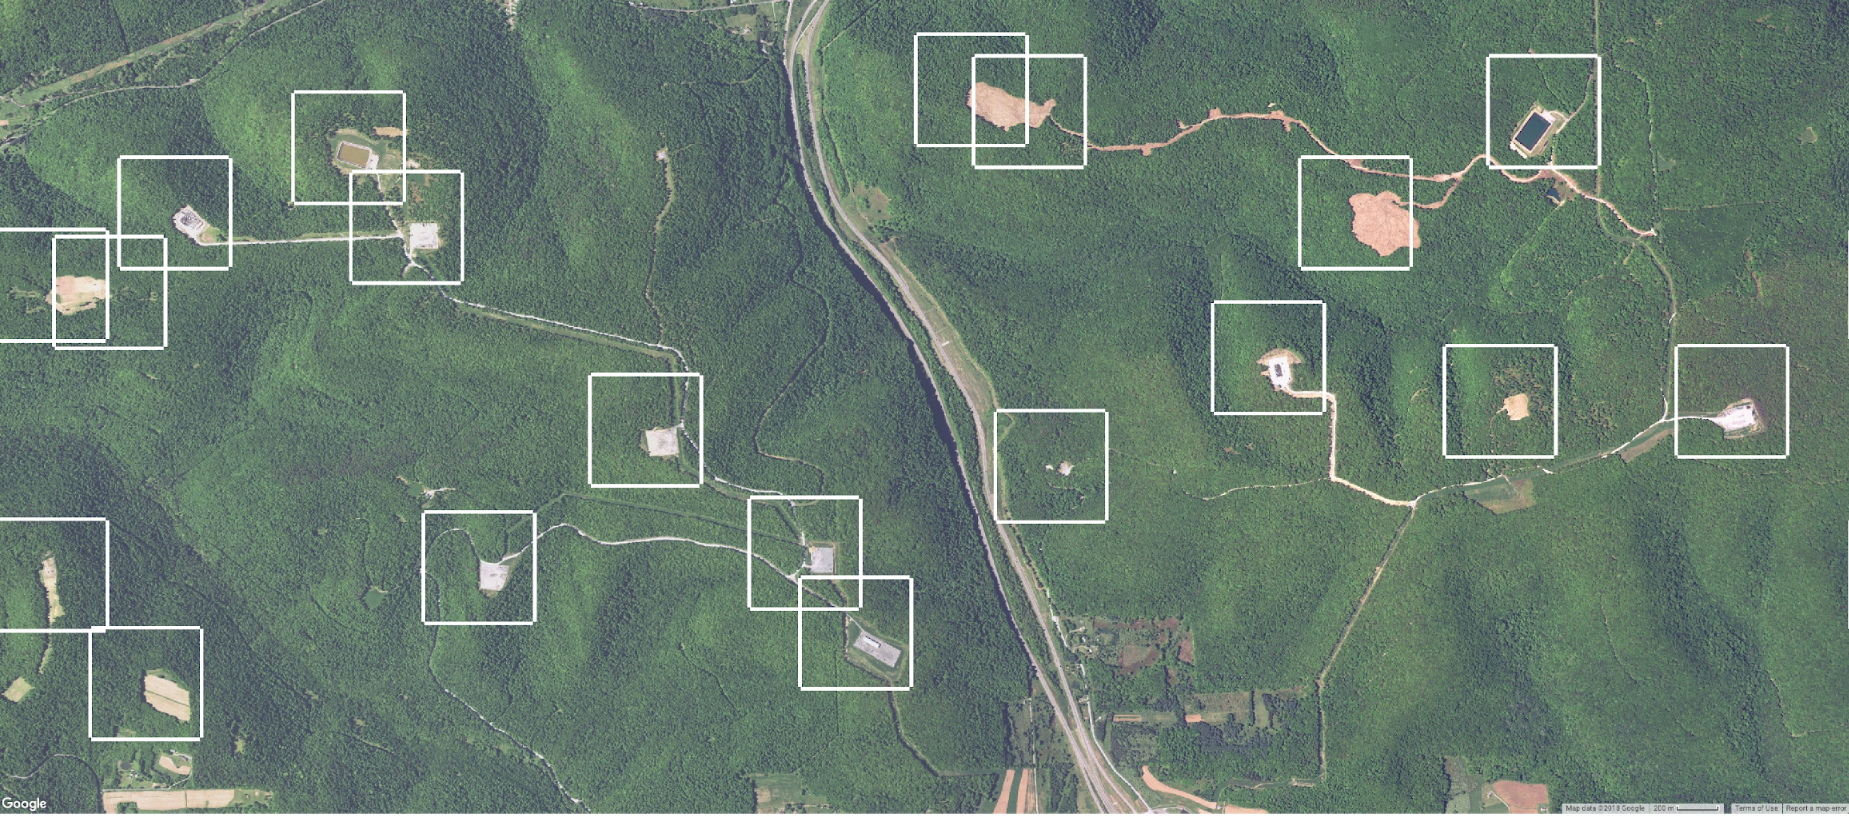
After training, we ran the model on a few NAIP images to compare its performance against well pads collected by SkyTruth volunteers for our 2015 Pennsylvania FrackFinder project. Figures 4 and 6 depict the model’s performance on two NAIP images near Williamsport, PA. White bounding boxes indicate landscape features that the model predicted to be well pads. Figures 5 and 7 depict those same images with well pads (shown in red) delineated by SkyTruth volunteers.
Figure 4. Well pads detected by our machine learning algorithm in NAIP imagery from 2015.Figure 5. Well pads detected by SkyTruth volunteers in NAIP imagery from 2015.Figure 6. Well pads detected by our machine learning algorithm in NAIP imagery from 2015.Figure 7. Well pads detected by SkyTruth volunteers in NAIP imagery from 2015.
One of the first things that stood out to us was that our model is overly sensitive to strong linear features. In nearly every training example, there is a clearly-defined access road that connects to the well pad. As a result, the model regularly classified large patches of cleared land or isolated developments (e.g., warehouses) at the end of a linear feature as a well pad. Another major weakness is that our model is also overly sensitive to active well pads. Active well pads tend to be large, gravel squares with clearly defined edges. Although these well pads may be the biggest concern, there are many “reclaimed” and abandoned well pads that lack such clearly defined edges. Regrettably, our model is overfit to highly-visible active wells pads, and it performs poorly on lower-visibility drilling sites that have lost their square shape or that have been revegetated by grasses.
Nevertheless, we think this is a good start. Despite a number of false detections, our model was able to detect all of the well pads previously identified by volunteers in images 5 and 7 above. In several instances, false detections consisted of energy infrastructure that, although not active well pads, remain of high interest to environmental and public health advocates as well as state regulators: abandoned well pads, wastewater impoundments, and recent land clearings. NAIP imagery is only collected every two or three years, depending on funding. So, tracking the expansion of oil and gas drilling activities in near real-time will require access to a high resolution, near real-time imagery stream (like Planet, for instance). For now, we’re experimenting with more current model architectures and with reconfiguring the model for semantic segmentation — extracting polygons that delineate the boundaries of well pads which can be analyzed in mapping software by researchers and our partners working on the ground.
Keep checking back for updates. We’ll be posting the training data that we created, along with our initial models, as soon as we can.
https://skytruth.org/wp-content/uploads/2019/02/image4-1.png8111856Ry Covingtonhttps://skytruth.org/wp-content/uploads/2020/11/SkyTruth-Header-Logo-C.pngRy Covington2019-02-13 13:45:372020-08-21 12:50:17Using machine learning to map the footprint of fracking in central Appalachia
Given SkyTruth’s mission of using the view from space to motivate people to protect the environment, it was only a matter of time before satellite imagery would find its way into our Alerts application. With 2019 comes the ability to visually check out what’s taking place in your areas of interest (AOIs), all inside the same application that notifies you about environmental events in those areas.
Newly available imagery in Alerts comes from Sentinel-2 satellites, an Earth observation mission from the European Union’s Copernicus Program. Copernicus systematically acquires optical imagery at high spatial resolution (10 to 60 meters) over land and coastal waters, with new images available about every five days in many areas.
What you can see with 10 meter resolution imagery
The 10m resolution images from Sentinel 2 satellites should work well if you’re searching for new roads, expansion of large disturbance areas, or changes in natural boundaries. But you’ll be disappointed if you’re trying to identify tree cover or the type of vehicle that’s parked in your driveway.
In a 10m resolution image, one pixel represents a 10 meter by 10 meter area, so objects will need to be considerably larger than that for any detail to be discernible.
Here are two 10m images over a gas drilling site in Pennsylvania, taken one year apart.
Most new features in Alerts require you to login. From alerts.skytruth.org, click on the LOGIN link in the header and follow the instructions. First time users will need to register for a new account.
NOTE: If you used our original Alerts, you’ll still need to register for an account the first time. Just remember to use the same email that you used to subscribe to AOIs in the original Alerts.
2. Identify the Area of Interest (AOI)
Start by clicking on the My Areas tab.
If you’ve already subscribed to an AOI, you can easily select it by clicking on its thumbnail.
Or, you can start a new AOI by clicking “Explore a New Area”.
3. Click the Sentinel Imagery checkbox.
4. Select your image date
Notes
Feel free to adjust the cloud cover or enter a date range, then click Filter to change the images that are available.
You can remove the alerts markers by, 1) Clicking the Alerts tab, 2) checking/unchecking the alerts you want on the map, 3) Clicking the My Areas tab to return the AOI controls.
If you like the AOI you’ve created, don’t forget to click Add this AOI to my list.
Use cloud cover percentage as a guidance. This represents the larger satellite image, which may cover substantially more area than your AOI. So it’s possible to have a low percentage of cloud cover and still have your AOI covered mostly by clouds.
You can add highways, towns, etc., to your image by clicking the Show Labels checkbox.
What’s next with Alerts and imagery
The true color images shown throughout this post are just part of what’s possible with satellite imagery. In addition to the red, green and blue bands that give images their true color appearance, most satellites catch additional bands that can include near-infrared, mid-infrared, far-infrared and thermal-infrared. Identifying landscape patterns and features using combinations of these spectral bands starts with additional processing by various data enhancement techniques, and is often followed by some type of classification algorithm to help understand what each feature or pattern represents. Doing this work is one of the challenges faced by SkyTruth Geospatial Analysts and other scientists around the world.
What do you think?
We’d like to know what you think about the addition of Sentinel-2 satellite images to the Alerts system: Will you use this new feature? What does it help you do? How does it fall short? We’re working to make continual improvements to Alerts and we’d love to hear from you! Send us an email at at support@skytruth.org.
https://skytruth.org/wp-content/uploads/2019/01/PApad2018-05.png739995Dan Cogswellhttps://skytruth.org/wp-content/uploads/2020/11/SkyTruth-Header-Logo-C.pngDan Cogswell2019-02-06 09:14:322023-11-06 13:34:05Satellite Imagery comes to SkyTruth Alerts
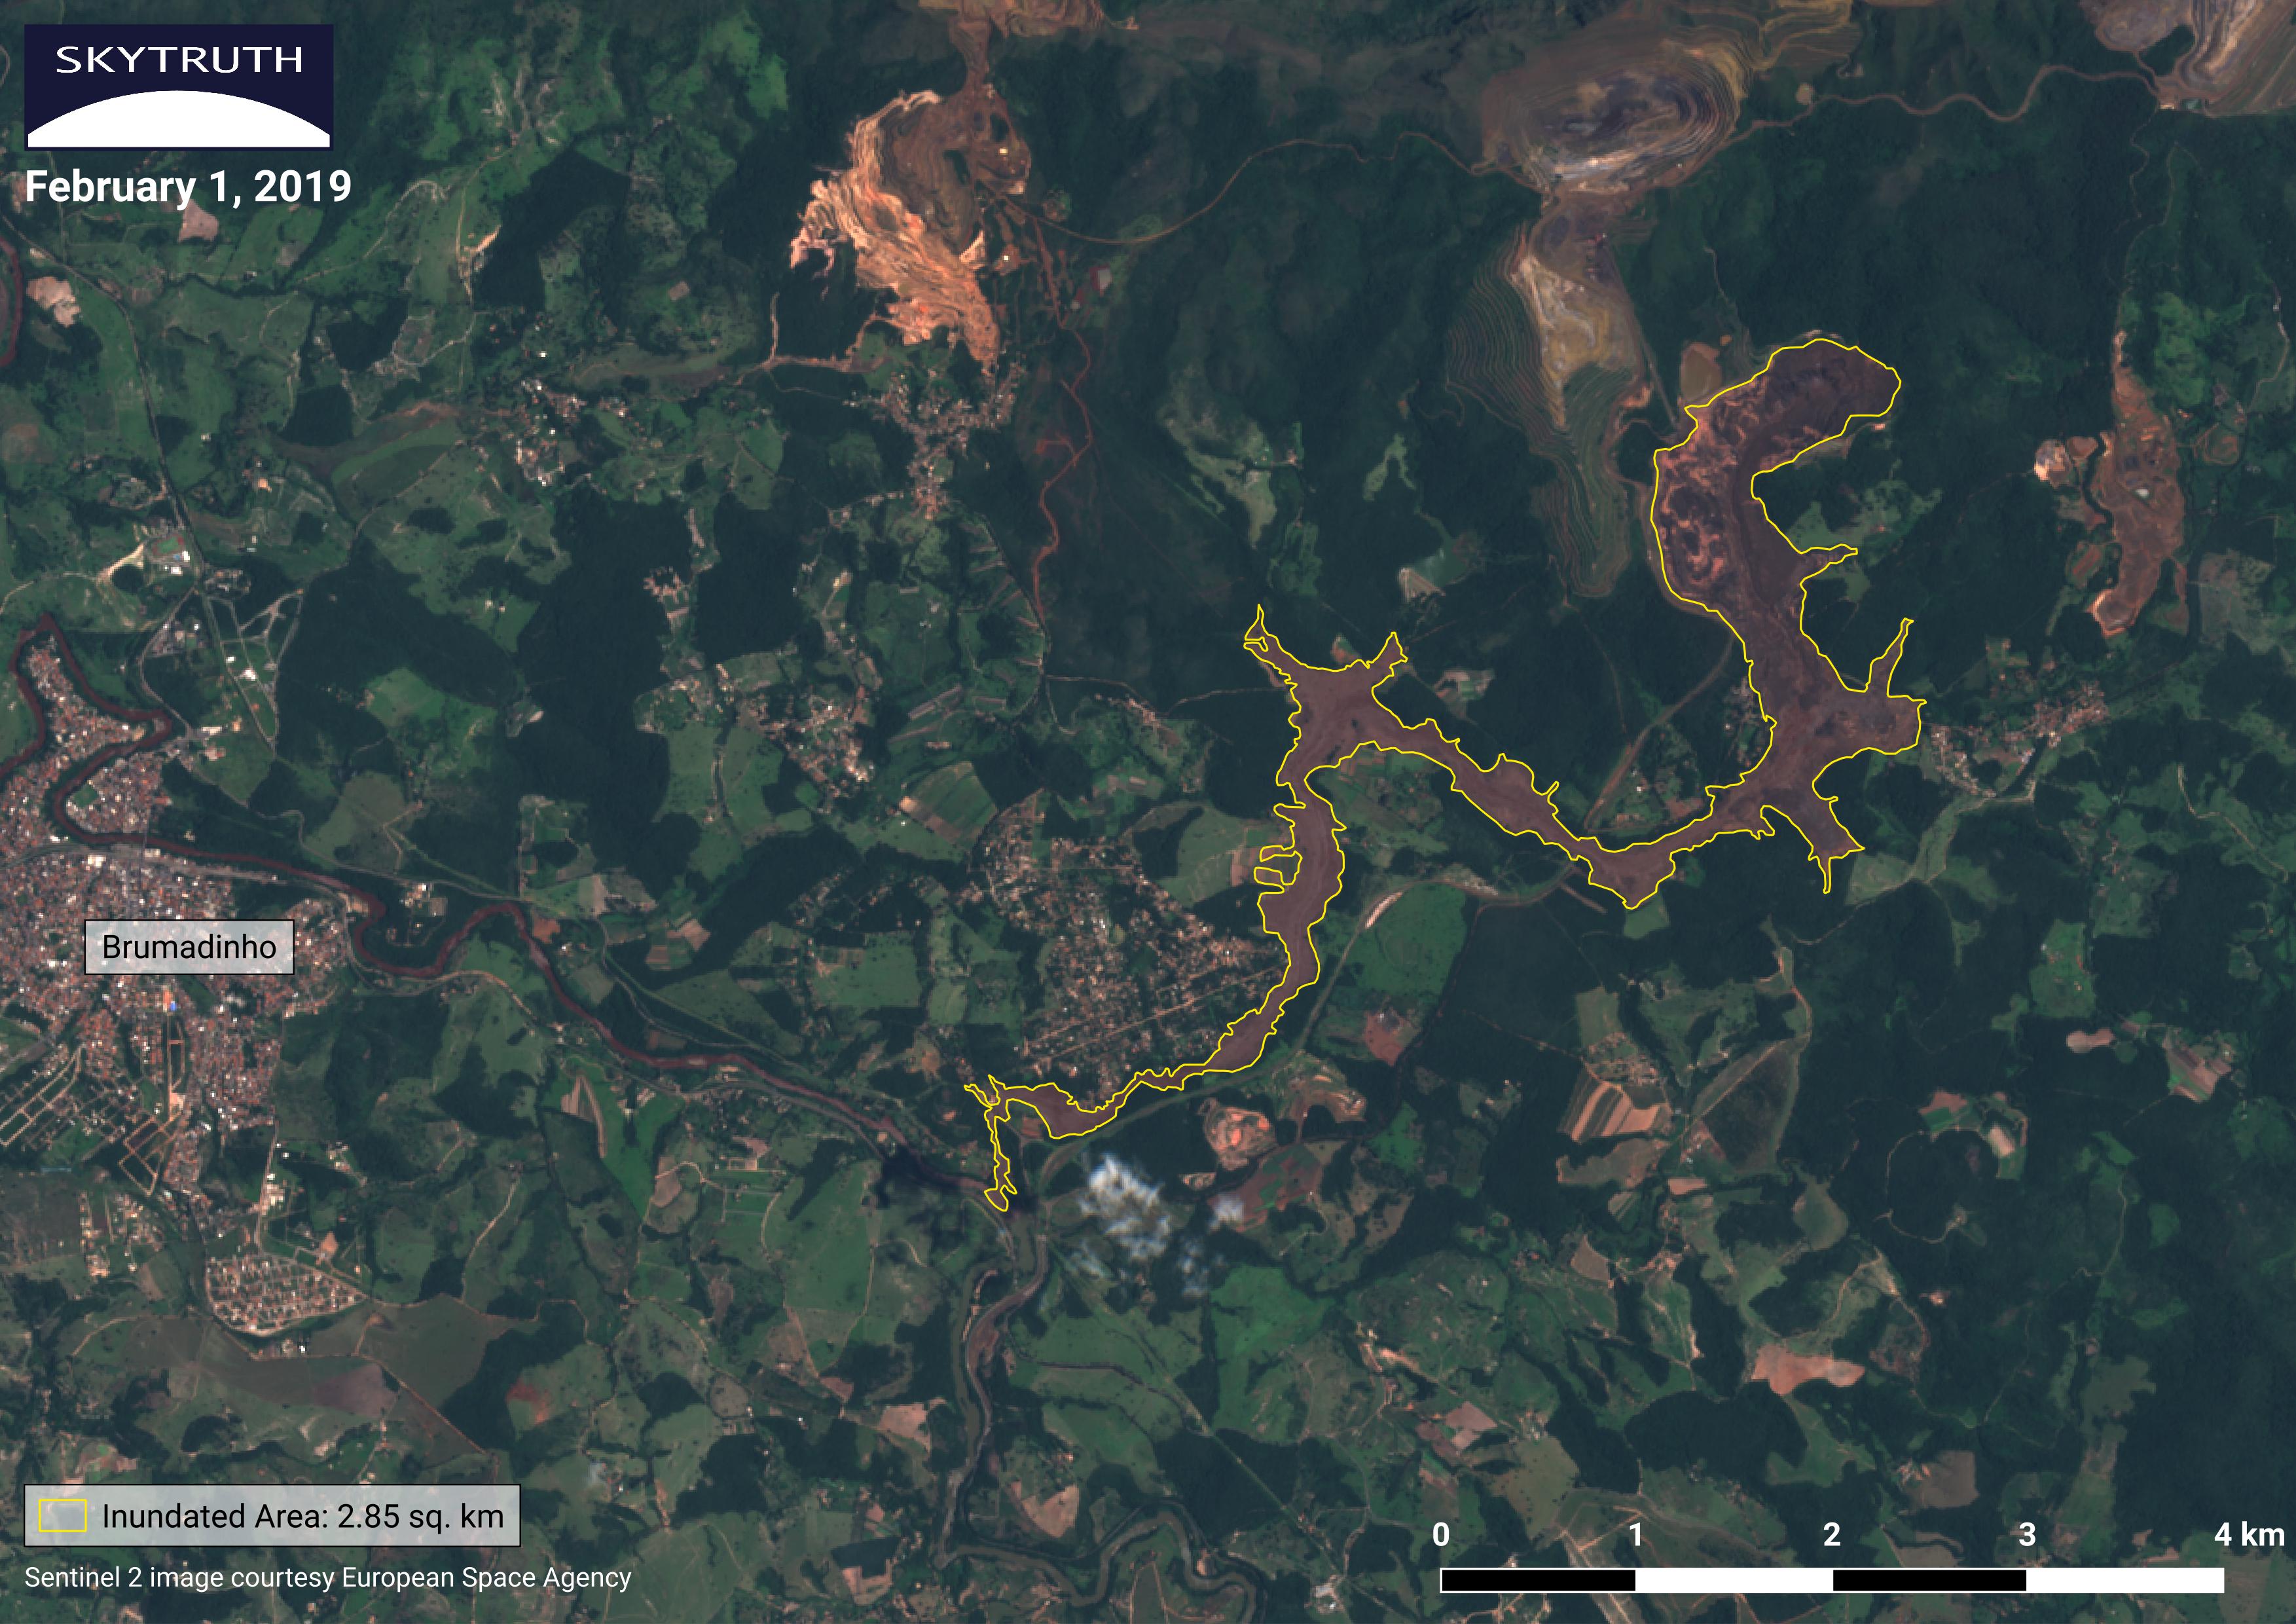
On Friday, January 25th, the tailings dam to the Córrego do Feijão mine burst near Brumadinho, State of Minas Gerais, Brazil (the moment of failure was captured on video). Operated by Brazilian mining company Vale S.A., this incident recalls the collapse of Vale’s Samarco Mine in 2015 which unleashed 62 million cubic meters of toxic sludge downstream. As of Monday, the death toll reached 120, however, the full extent of damage is unknown. To monitor the impact, here is a Sentinel-2 scene of Córrego do Feijão from eighteen days before and seven days after the dam’s failure. As of February 2nd, approximately 2.85 km2 of sludge surrounds the region.
This slider, below, shows the area near the town of Brumadinho before and after the dam failure with the inundation highlighted in yellow, it can be accessed here.
https://skytruth.org/wp-content/uploads/2019/02/Vale_After.jpeg24803507Lucy Meyerhttps://skytruth.org/wp-content/uploads/2020/11/SkyTruth-Header-Logo-C.pngLucy Meyer2019-02-05 13:21:042020-08-26 17:00:28Monitoring the tailings dam failure of the Córrego do Feijão mine
When I was brought on to intern at SkyTruth, I was presented by one of our analysts, Ry Covington, with a rather open-ended challenge: “Here at SkyTruth, we want our internships to be a learning experience first and foremost. With that said, you can learn almost anything you want while working here. Think about your main goals, what you hope to get out of these next few months and let me know so that we can decide together how best to help you achieve your goal.” This isn’t verbatim, but it hits the mark in regards to the message he was conveying. I already knew the answer to this question, because it was something that I had thought about even before I started at SkyTruth: I had a strong desire to learn programming, especially as it pertains to the field of geospatial analysis. Now mind you, this is coming from someone who is brand new to programming in any respect. I had one class in C++ my sophomore year of college and all of that information has since slipped my mind, as most unimportant (or at least I regarded it as unimportant at the time) college course material does. I also had attempted to teach myself Python the summer before I started at SkyTruth while rehabilitating a nasty toe fracture, but that information didn’t quite encapsulate what I hoped to achieve with coding. I only knew the foundational pieces of what it means to communicate with a computer through coding, such as iterators, variables, and Boolean operators.
Around a month or so into the internship I received my opportunity to work towards my goal. Ry had a project he was doing with the Heinz Foundation that involved creating a map which detailed potential well pad sites in Allegheny County, PA (to see my blog post detailing the final results of this study, follow this link). We worked out a research approach and came up with a plan to map out these locations that seemed logical to both of us. Great. Now here’s an idea: let’s take all of those things that we want to incorporate into this project and write that into a Google Earth Engine (EE) script. On top of that, let’s also publish an app which uses this same Earth Engine script. These suggestions made by Ry seemed fine and well, until the moment where he delegated the task of writing this script unto me. In his words, “It’s a steep learning curve, but you’re a smart guy. You’ll figure it out!” He left the room as he was making this statement, leaving me stunned like a deer in headlights. Yes I wanted to learn to program, but this seemed excessive! After a few moments of processing, I collected myself and turned to the most trustworthy source of them all for guidance: Google Search. Looking up “Google Earth Engine tutorial” led me to a website which detailed the functions which you can use to make neat little UI plugins in your EE code. After a day of playing with them and applying some of the sample code they offered, I figured out how to display the elements of interest on the map. Following this discovery, I excitedly called to Ry to come and look at what I had made. He took one look at what I had done and said, “Good job Brendan, that’s an excellent start. Keep going.” Wait, this wasn’t what I was trying to get? It was an excellent start, which meant I was nowhere near the end. So it was time to expand my search for information.
An example of the guides found on Google’s official Earth Engine site.
At Ry’s suggestion, I looked at the code that one of SkyTruth’s other analysts, Christian Thomas, had written in EE for global ocean monitoring. This turned out to be an invaluable source of information for me but it was intimidating at first glance. The script itself is composed of over 500 lines of intensely in-depth code that made no sense to me whatsoever. On more than one occasion, I found myself becoming lost in the script’s intricacies while trying to find answers to my own predicament. Nevertheless, I remained determined to figure out how to compose my script, so I proceeded forward with the examples Christian’s code offered me. My program would involve creating a panel on which I’d load on a few buttons with different unique functions that built off of each other to display different text and layers on the panel and the map, respectively. Needless to say, my first few stabs at all of this led me to fall flat on my face. I could create the buttons that I wanted, but I couldn’t for the life of me figure out how to put the buttons on the side panel that I’d made. I spent roughly two weeks trying to get over this hurdle.
It was nice to have the encouragement of my mentors to keep me motivated to seek the answer to this question. Without Christian and Ry’s calm demeanors and calculated approach to solving these programming issues, I probably would’ve lost hope quickly. Days of work would go by and I’d spend a lot of time carefully combing through my code trying to discover the answer to my plight. Even when I was at home at night, I’d think about ways I could get to the result I desired. Then one day, all at once, it hit me. It was like the roadblock in my mind was slammed into by a Mack truck and just like that I figured out how to get the buttons to display on the side panel. To describe the feeling as a whole is difficult, but I think I could compare it to the way I felt as a little kid on Christmas morning when I rushed down the stairs and saw presents underneath the Christmas tree. I jumped up out of my seat, did some silent yelling, and added in a few fist pumps for good measure. I was elated! The cool part about it was that once I broke through that wall, it was like the rest came naturally. My fingers fluttered across my keyboard as I coded exactly what I had in mind for this project. Before I knew it I had an EE script that was logical and effective. I remember when Ry and Christian first looked at my latest script and they had nothing but good things to say about what I had accomplished. That positivity made me feel great; it was a huge payoff after a great deal of tribulation. I had finally done it!
A screenshot from my finished app.
Now that I reflect on the path I followed to create this code, I’m astounded by how much I learned. I learned more in those few chaotic weeks than I would typically learn over the course of a semester long college course! It was a chaos that you can’t quite replicate in the classroom because there aren’t people depending on you when you’re doing homework or taking a test. The urgency to make your product the finest ever conceived is palpable. You do the best that you can for your coworkers, who end up being more like your friends here at SkyTruth. I think that hits the nail on the head when considering the mission of SkyTruth overall; we’re all here to provide information for others so that they can do meaningful work in defending our precious environment. Every task you work on here could have an effect on your world, so you do everything you can to give every project your all. I definitely got way more than I bargained for when I said that I wanted to learn to program at SkyTruth. Despite that, I couldn’t be more satisfied with the work I was able to do over my first few months here.
If you would like to view my completed app, please click here!
https://skytruth.org/wp-content/uploads/2018/09/brendan_square.jpg200200Brendan Jarrellhttps://skytruth.org/wp-content/uploads/2020/11/SkyTruth-Header-Logo-C.pngBrendan Jarrell2019-02-05 11:43:502020-09-23 11:33:06From Trial to Triumph: Learning to Code at SkyTruth