New – Interactive Map of Real-Time Weather and Energy Infrastructure
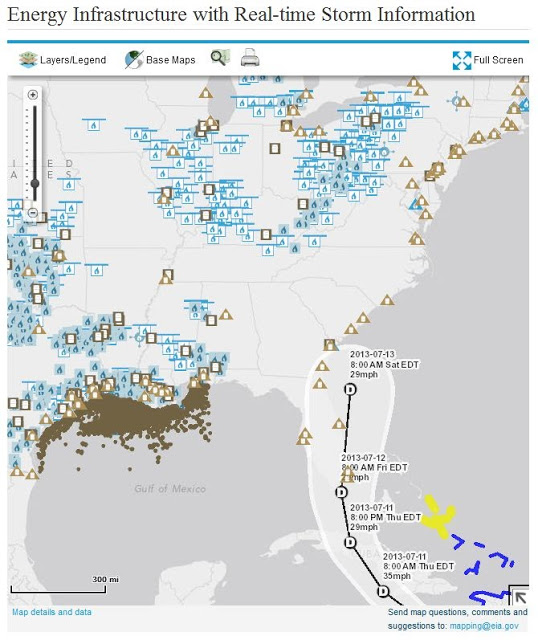
Here’s a great new service provided by the Energy Information Agency (a treasure trove of data, statistics and information about energy imports, exports, consumption and more): an interactive map showing real-time information about severe weather events, along with data layers for energy infrastructure like power plants, offshore oil and gas platforms, major transmission lines, etc.
With hurricane season upon us, this is an excellent tool for seeing at a glance the energy facilities and communities that could be at risk from storm damage. Check it out.


