Sea Ice Receding at Shell’s Alaska Drill Sites
Last January, fellow SkyTruther Sara Scoville-Weaver wrote an article, Black Ice Is Never A Good Thing…, about potential drilling in the Arctic Ocean and how a large oil spill – like the one caused by Shell and spotted on satellite image by SkyTruth last December off the coast of Nigeria – could affect the waters off the coast of Alaska where Shell is now poised to commence drilling.
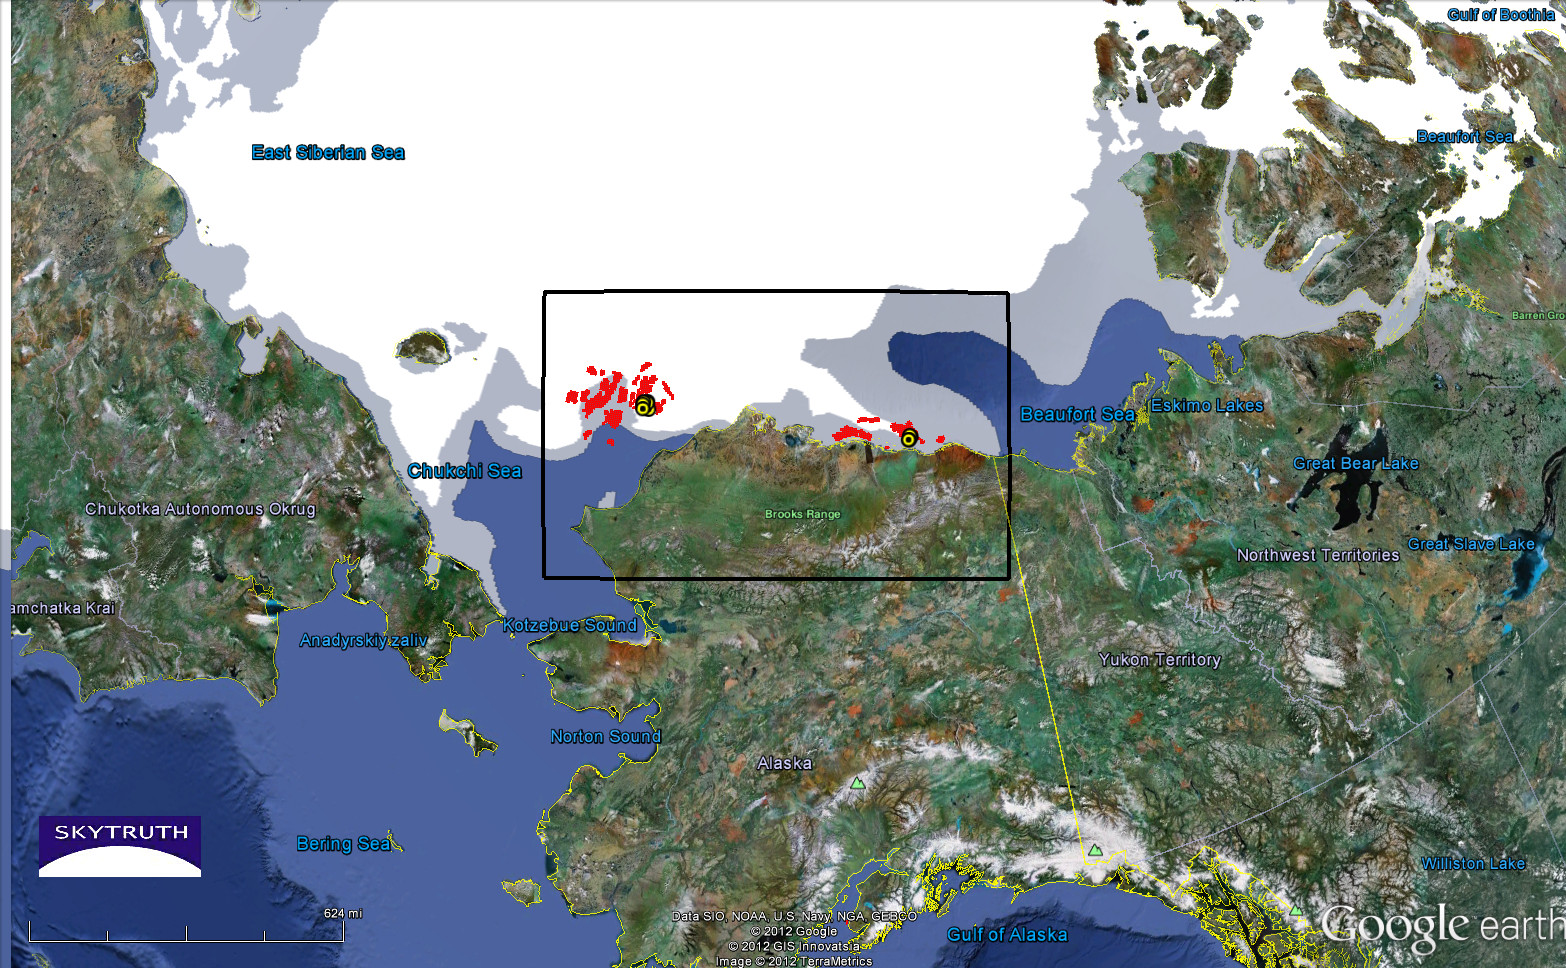
Wide view of Shell’s drilling areas in the Chukchi and Beaufort Seas off the north slope of Alaska
Since then, we have been monitoring the changing sea ice using data published by the National Ice Center at NOAA. The sea ice extent varies dramatically from winter to summer, and even the daily variations can be substantial.
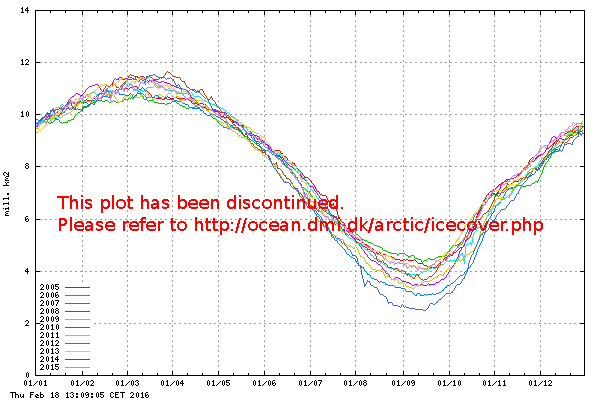
This graph that we got from the Danish Meterological Institute shows the average Arctic ice coverage over the course of the year, in millions of square kilometers. As you can see, August (01/08) marks the beginning of the part of the year with the least ice coverage; the lowest being through the month September (01/09). The black line indicates this year (2012).

Yearly ice coverage data in millions of sq km. Source: Danish Meteorological Institute
Shown below are a series of sea ice maps from the National Ice Center covering the last three weeks. The large white portions represent thick ice coverage, the grey is thin or broken up ice. Red squares show lease blocks which could be potentially drilled. The yellow points are Shell’s planned drilling locations.


Images showing recent weekly change in sea ice coverage in the vicinity of Shell’s planned offshore drilling sites.
As you can see, even this far into the summer season, Shell’s planned drilling sites are still impacted by sea ice, and the ice coverage is still changing drastically from week to week. We shudder (or shiver) to think what it would take to mobilize an oil spill response on the scale of the response to BP’s 2010 disaster in these icy, unpredictable conditions.
