Gas Drilling Time Series Analysis in Pennsylvania
Back in June, Yolandita and David’s frack related blog posts and video, put the amount of materials used in a typical hydrofracturing operation into a perspective that was easier to grasp. With a better idea of how much fluid is used in every operation fresh in your head, I would like to give you an idea of how many fracturing operations there are.
The Marcellus formation is a large basin of shale in the United States. The formation dips 9,000 feet below the surface in the Southwestern and Northeastern portions of the state, but is exposed to the surface in central Pennsylvania. Natural resource companies are interested in these formations because of natural gas contained within the impermeable layers of shale. By installing deep wells and then hydrofracturing, these gases can be extracted. Hydrofracturing has only subtle impacts to the surface’s appearance, however the impact to the lives of those who are living near these fracturing sites is a large and continually growing concern for many.

Screen shot of Google Earth. The State of Pennsylvania. The arrow points to our frame interest and the bordering states of PA have been color coded.
In November 2010 a joint effort by The Nature Conservancy (TNC), Western Pennsylvania Conservancy, and Audubon Pennsylvania produced a map published on The Nature Conservancy’s website. The map places a mark on all drilled and permitted Marcellus Shale natural gas drilling locations. Within the crowd of hundreds of place-marks, there were locations where wells were extra concentrated. I selected one of those areas to investigate, using imagery available in Google Earth.
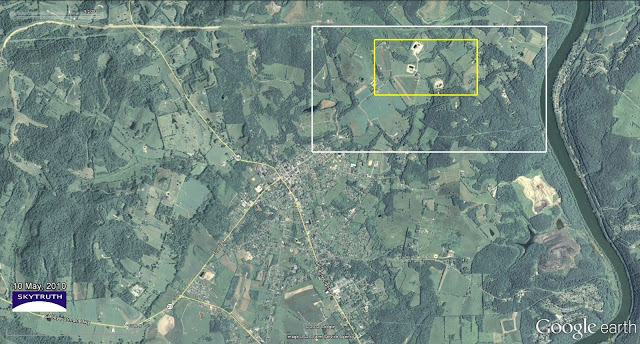
Screen Shot of Google Earth, Imagery from 10 May, 2010. The yellow and white boxes frame the areas that I inspected more closely.
The image above centers Carmichaels, PA. and two areas of further investigation are also framed in the image. The borough of Carmichaels, as of the 2000 census, has a population of about 500 people. This small town, located near the Monongahela River, on the crossroads of rt.21 and 88, served as a landmark for my investigation. From a visual inspection, there were plenty of wells to take a look at here.
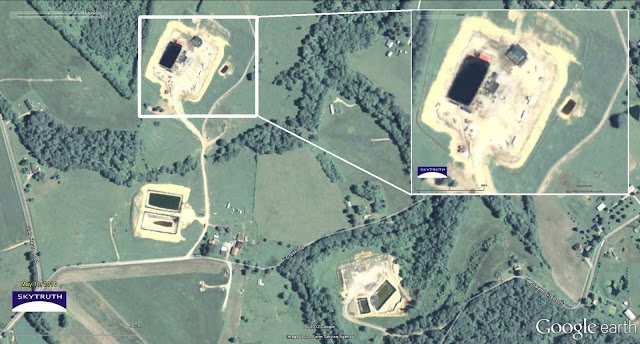
Screen shot of Google Earth, Imagery from 10 May, 2010. Two Marcellus Shale Formation wells. Northern location is magnified in a window.
The image above is an example of Marcellus Shale Formation drilling; waste-water retention ponds, trucks, storage tanks, and uneven and unpaved roads leading to square patches of barren ground are common characteristics of gas wells that have been fractured. All Marcellus Shale Formation wells must be fracked in order to be profitable.

Screen shot of The Nature Conservancy’s map of the locations of Marcellus Shale Formation that have been drilled. (the place marks have been enlarged from their original appearance.)
The Nature Conservancy’s map provided location of drilling pads that extract gas from the Marcellus Shale Formation.

Screen Shot of Google Earth, Imagery from 10 May, 2010.
In the image above, the Marcellus Shale Formation gas well locations are marked in pink, and the blue marks under the pink marks represent the permits. The roads have been traced in red for comparison to the TNC’s online version of the map.
Many gas well sites are not as large or noticeable as Marcellus Shale wells, and may or may not have been fracked. There is no comprehensive source of information available to determine whether the well has been fracked, therefore, we marked all drilled gas wells (spuds).
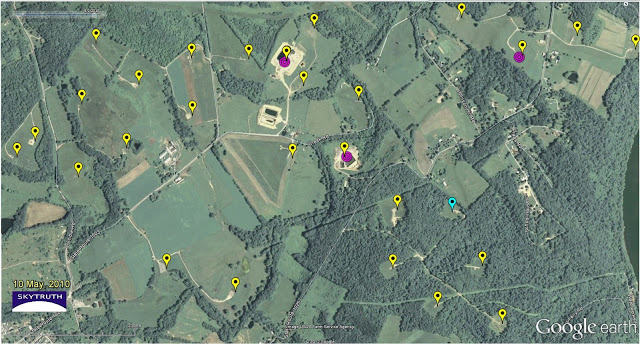
Screen Shot of Google Earth, Imagery from 10 May, 2010. Marcellus Wells are marked in pink. All spud reports are denoted with yellow marks, the light blue mark of the same shape is a well I discovered in the imagery. The overlapped blue marks are Marcellus Formation drilling permits.
I layered a collection of all of the reported spuds on top of this view to get an idea of the ratio of gas wells in the area that are not utilizing the Marcellus Formation.
This was an astonishing discovery for me, finding so many drilling reports in such a small space. In this ~3square mile area there are 27 spud reports, and only three of those are Marcellus Formation wells. While I had all of this area framed, I wanted to see how quickly these wells appeared in the area. By flipping through historic imagery in Google Earth I was able to make a time series.
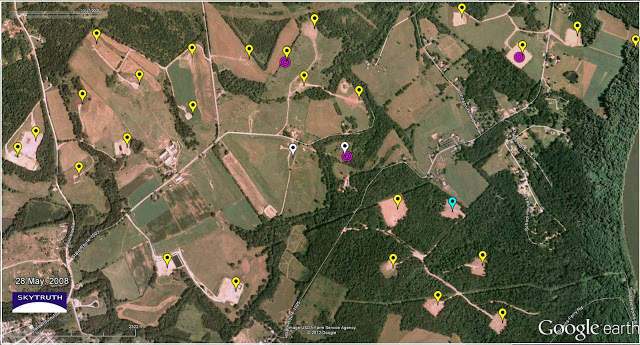
Screen shot of Google Earth, imagery dated 28 May, 2008.
In the image above I gave the single spud location that was not present in the image a white marker, all other wells are still present, and yellow. Note the cleared areas around the spud locations and the lack of water retention ponds in the Marcellus areas.
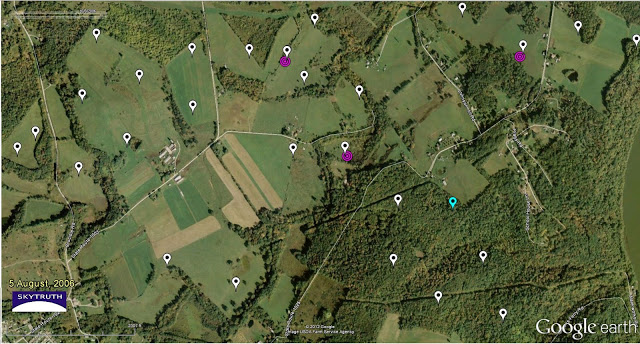
Screen shot of Google Earth, imagery dated 5 August, 2006.
In the third image, dated the 5 August, 2006, there are no wells of any kind and all of the marks have been changed to white.
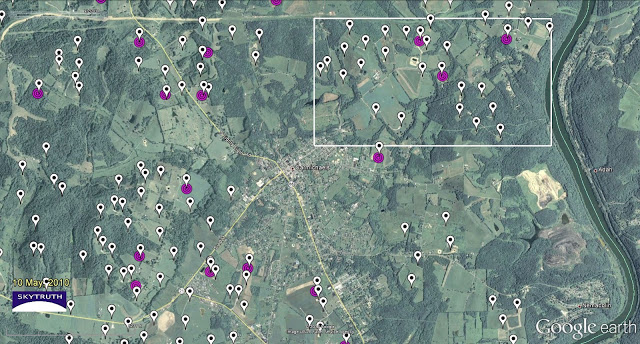
Screen Shot of view over Carmichaels, PA.Image dated: 10 May, 2010. Pink marks are Marcellus wells, and white markers are spud locations from any type of gas well. The location of the previous image has been outlined in white.
In the image above, many more spuds are visible. I counted 127 total spuds including 17 Marcellus Shale Formation wells. There are very few wells very close to populated areas, such as downtown Carmichaels, however, in the rural area, there is a higher concentration. This pattern is similar for many cities in Pennsylvania that were built above the natural gas shale formations.
The concentration of spuds in this map provides an idea of the total cumulative impact that natural gas extraction can have on the surface of the land. Many of these wells, including the Marcellus Shale wells, undergo the process of hydrofracturing that also impact the features under the surface. However, it is important to note that surface impacts from non-Marcellus drilling could have an even larger impact in the state of Pennsylvania, and The Chesapeake Bay.

