Growing Coal Mines in the Powder River Basin
Lately coal export has been getting a lot of attention in the media. Exporting coal from the US to overseas markets means an increase coal mining activity and an increase in train traffic through communities between the mines and coastal export terminals. Last fall, I blogged about the massive 7,500 foot long coal trains, to get a feel for how this might disrupt those communities. This time around, we are taking a look at the “business end” of coal-export: the actual mining of the coal.
The National Wildlife Federation (NWF) is concerned about what coal export means for the landscapes and habitats of the Rocky Mountain West. They asked if we could produce a few visualizations to illustrate how much of the land is being affected by mining, and would likely be affected if we ramp up coal exports.

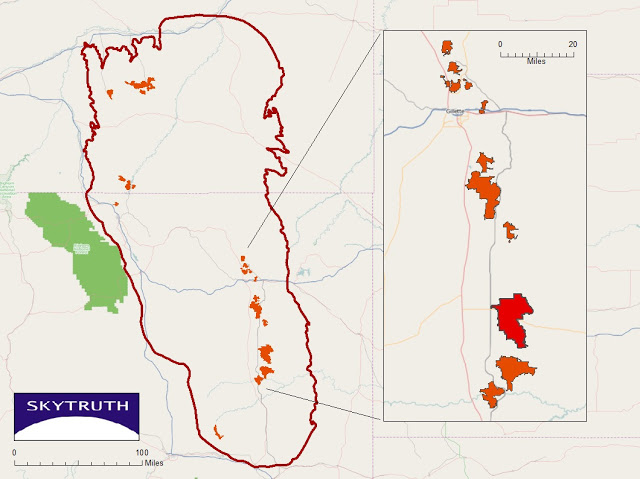
Outline of the Powder River Basin in Montana and Wyoming. Black Thunder Mine shown in red. All other mines shown in orange.
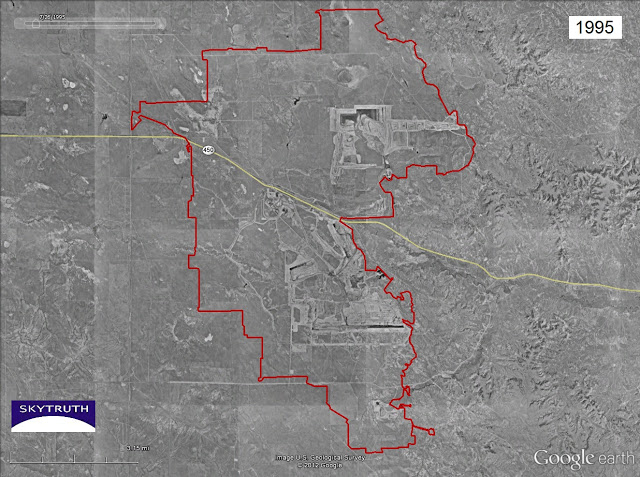
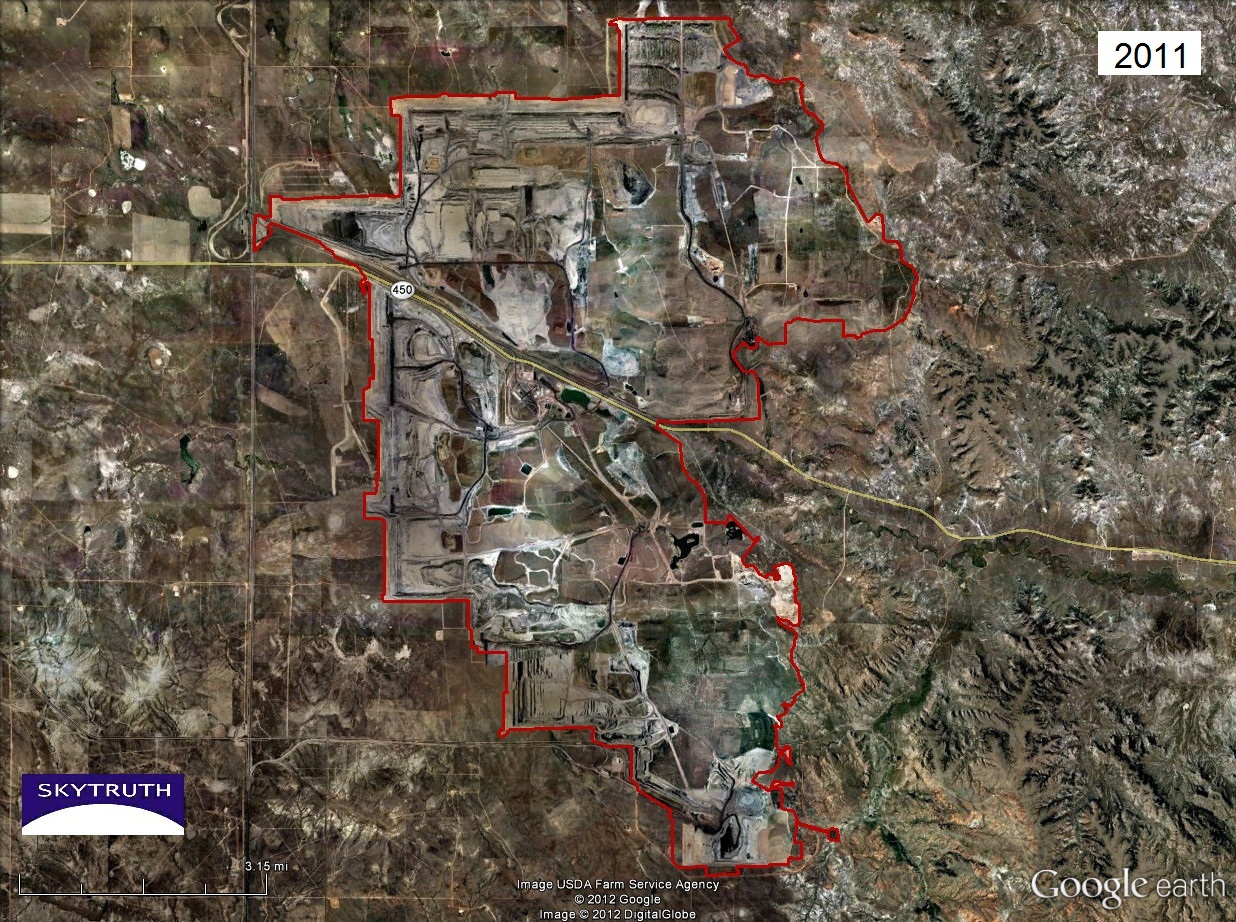
Using Google Earth Pro, I delineated all of the mining activity in the Powder River Basin (PRB) of Wyoming and Montana, the main coal-producing region in the Rockies that would feed the export market. I then imported the file into ArcGIS. There, I placed the mining activity over a map of the US, and created an inset map to show a closer view of a heavily mined area (see map above) about 40 miles south of Gillette, Wyoming. I homed in on the Black Thunder Mine (shown in red) to demonstrate how mining activity in the PRB has increased over time. Seen below, is the mine as it appears on black-and-white aerial survey photography shot in 1995. The lighter areas on the image show the bare dirt and rock of actively mined areas. The red outline shows how much land had been directly impacted by mining sixteen years later, in 2011. It has grown 29.3 square miles in that 16-year period.

The Black Thunder Mine, located in the Wyoming section of the PRB, as of 1995. The lighter areas represent active mining area on this black-and-white aerial survey photography. The red outline represents the extent of mining activity as of 2011.

The Black Thunder Mine, located in the Wyoming section of the PRB in Wyoming, as of 2011 (color aerial survey photography).
But numbers alone don’t fully convey how big this coal-mining activity is throughout the PRB. Let’s compare it with something more familiar in scale to many of us. Below is a map of San Francisco for reference. We’ll call this the “before” shot:
Thanks to fellow intern Patrick — who helped figure out how to move the footprint of the mine from Wyoming to California — I’ve provided a map of the Black Thunder Mine superimposed on San Francisco (shown below) as a more familiar frame of reference… The “after” shot:
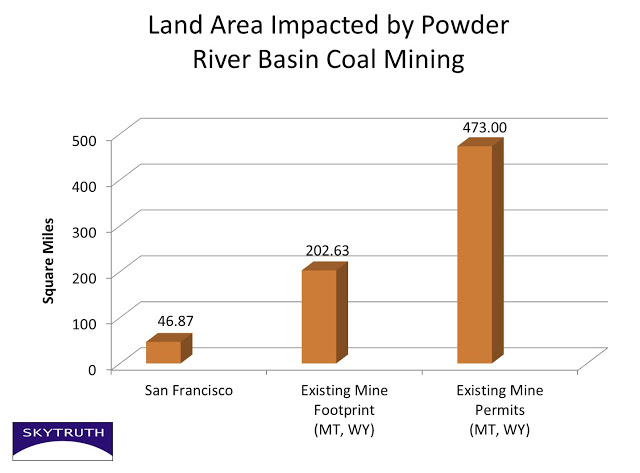
Remember, this is just one of the huge mining complexes that already exist in the PRB. So how much of our Western high-plains landscape is currently impacted by mining? And how much is that likely to grow, especially if we start systematically exporting our coal to foreign countries? I’d already delineated the existing mine footprints on the 2011 Google Earth imagery. I then collected GIS data from state agencies in Montana and Wyoming for all the current mining permits in the PRB. The permits show the area where mining operations have been approved by state regulators, so it’s likely most if not all of that area will ultimately be impacted.
Below is a graph that neatly expresses how large the mined area in the PRB is compared to San Francisco– and more astoundingly, how large the mines may grow. If all the currently permitted areas were used to the full extent for coal mining and coal mining related activity, that would double the area of disturbed land, big enough to swallow up ten San Franciscos! Exporting coal will speed up the mining and make this much more likely to happen. This analysis doesn’t attempt to predict the additional coal leasing and new mine permitting that would probably be driven by exporting coal.


