BP / Gulf Oil Spill – What Did Bonnie Do?
The center of Bonnie’s circulation appears close to the Macondo well site on a CSK radar satellite image taken July 24. CSK and MODIS satellite images the next day, July 25, show remnants of the BP oil slick scattered around the Mississippi Delta. No new oil is seen around the well site; it’s been tightly capped since July 15.

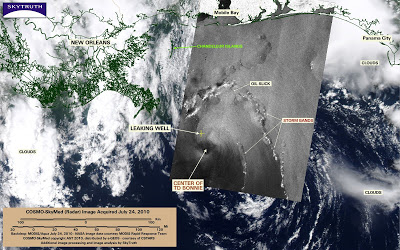
COSMO-SkyMed radar satellite image showing center of circulation of tropical depression Bonnie, July 24, 2010. CSK-1 image courtesy CSTARS. Backdrop (color) is MODIS/Aqua image from earlier the same day.
The center of circulation for tropical depression Bonnie was located about 15 miles (24 km) south-southeast of the Macondo well site when this CSK-1 radar satellite image (black-and-white) was taken, at 6:44 pm local time. Weather station 42364, on the Ram-Powell oil platform about 27 miles (43 km) northeast of the Macondo well, recorded sustained wind speed of 22 mph (10 m/s) at that time. Station 42887 on the Thunder Horse oil platform about 39 miles (63 km) south of the well recorded winds at 11 mph (5 m/s).
Radar images show the “roughness” of the ocean’s surface, revealing the pattern of Bonnie’s counterclockwise-circulating winds. The strongest winds are generally in the northeast quadrant of cyclones in the northern hemisphere. This is reflected by the overall gray tone in the radar image: the area of stronger winds north and east of the storm’s center is brighter than the area to the south and west.
Two distinct storm bands are also apparent; these are lines of strong thunderstorms with gusty winds. A narrow line of oil slick is also visible – possibly related to the BP / Deepwater Horizon spill, although we think most of the slick and sheen from that spill is obscured on the radar image by the strong wind conditions.
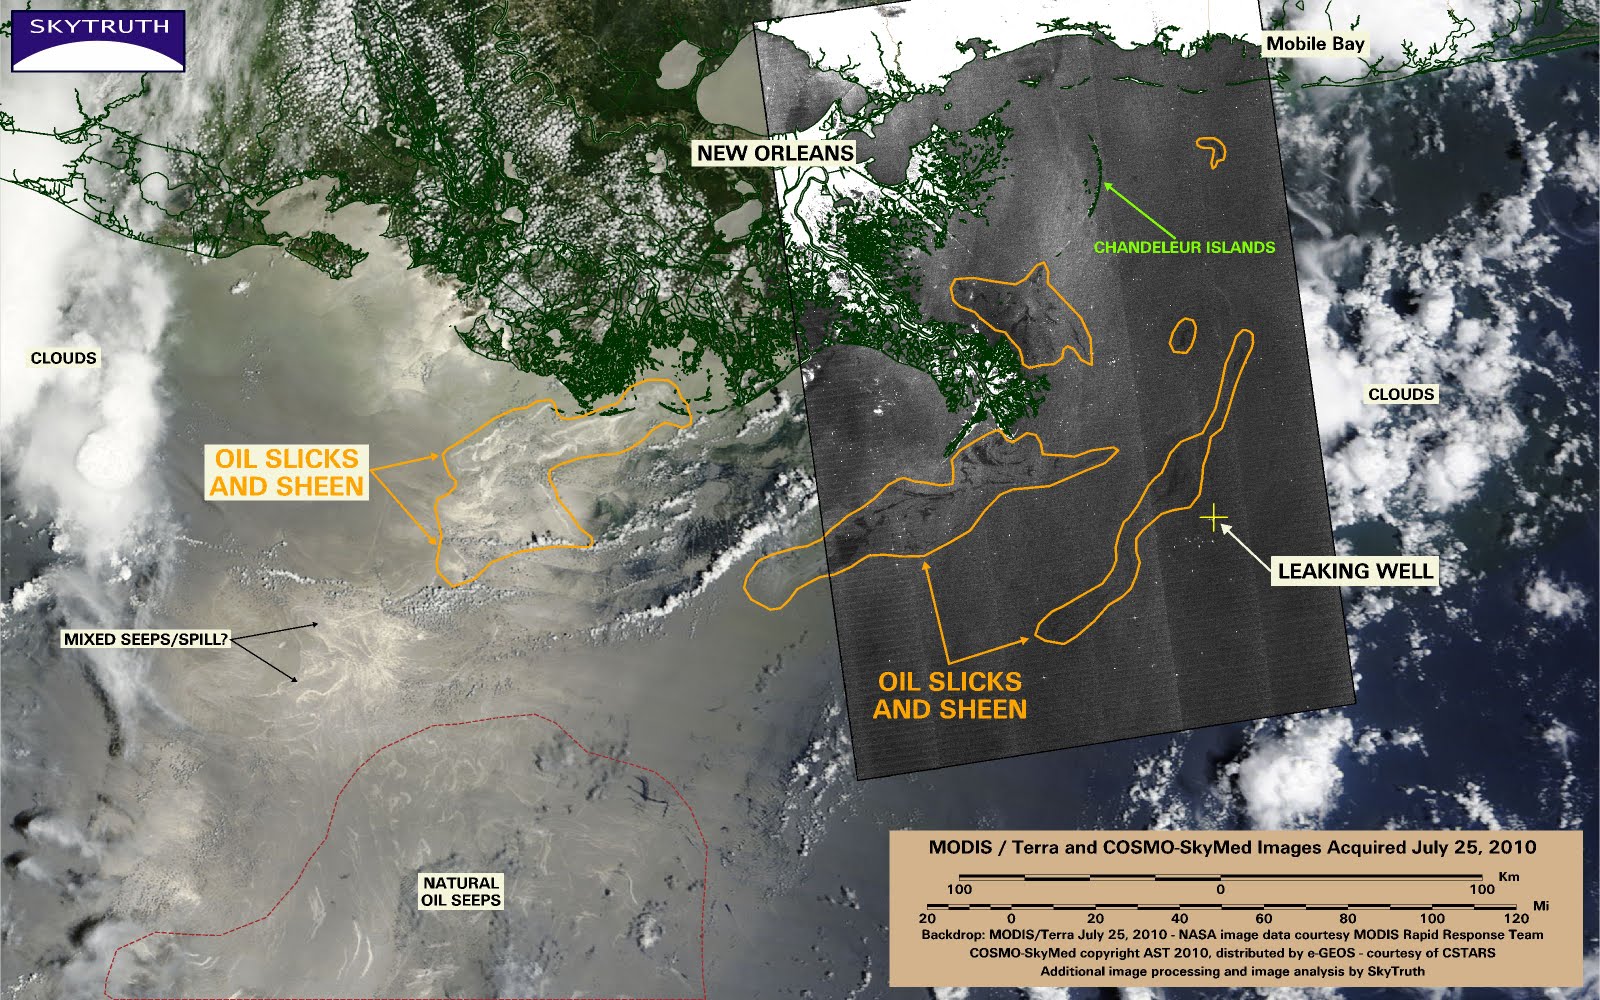
COSMO-SkyMed radar and MODIS/Terra satellite images taken July 25, 2010, showing remnants of BP oil slick. CSK-1 image courtesy CSTARS.
CSK radar and MODIS / Terra satellite images taken on July 25, 2010, show the effects of tropical depression Bonnie’s passage on the oil slicks and sheen from the spill. No new oil is seen in the immediate vicinity of the well. But remnants of the oil slick are visible around the Mississippi Delta.
The MODIS image also shows dozens of small oil slicks from natural oil and gas seeps. These seeps appear unusually active, possibly due to seafloor disturbance caused by Bonnie. A bright area of slicks or sheen between the spill-related oil slicks (orange line) and the area of active seeps (dashed red line) could be where oil from both sources is mingling.
See all of SkyTruth’s images related to the BP / Deepwater Horizon spill in our gallery.

