Gulf Oil Spill – Radar Satellite Image May 8, 2010
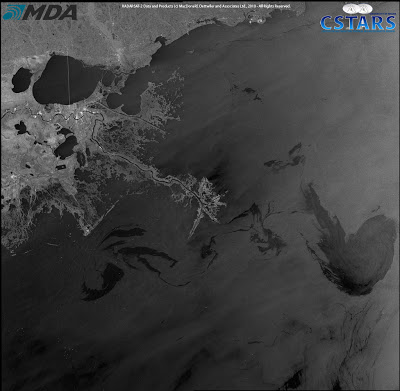
Our friends at CSTARS just posted this stunning image. Taken by the Canadian-operated radar satellite, RADARSAT-2, it clearly shows oil slicks and sheen spread across a wide area (about 5,025 square miles, or 13,000 km2) in the Gulf of Mexico early this morning (May 8):

RADARSAT-2 image of the Gulf of Mexico, May, 8, 2010 – Source: CSTARS
We’ve added some analysis to help you armchair interpreters. Oil slicks look dark on radar images because the oil reduces the surface tension of the water, dampening (smoothing out) the small wavelets that normally roughen up the surface of the ocean. But any smooth water will look dark on radar, so not all dark patches are caused by oil:
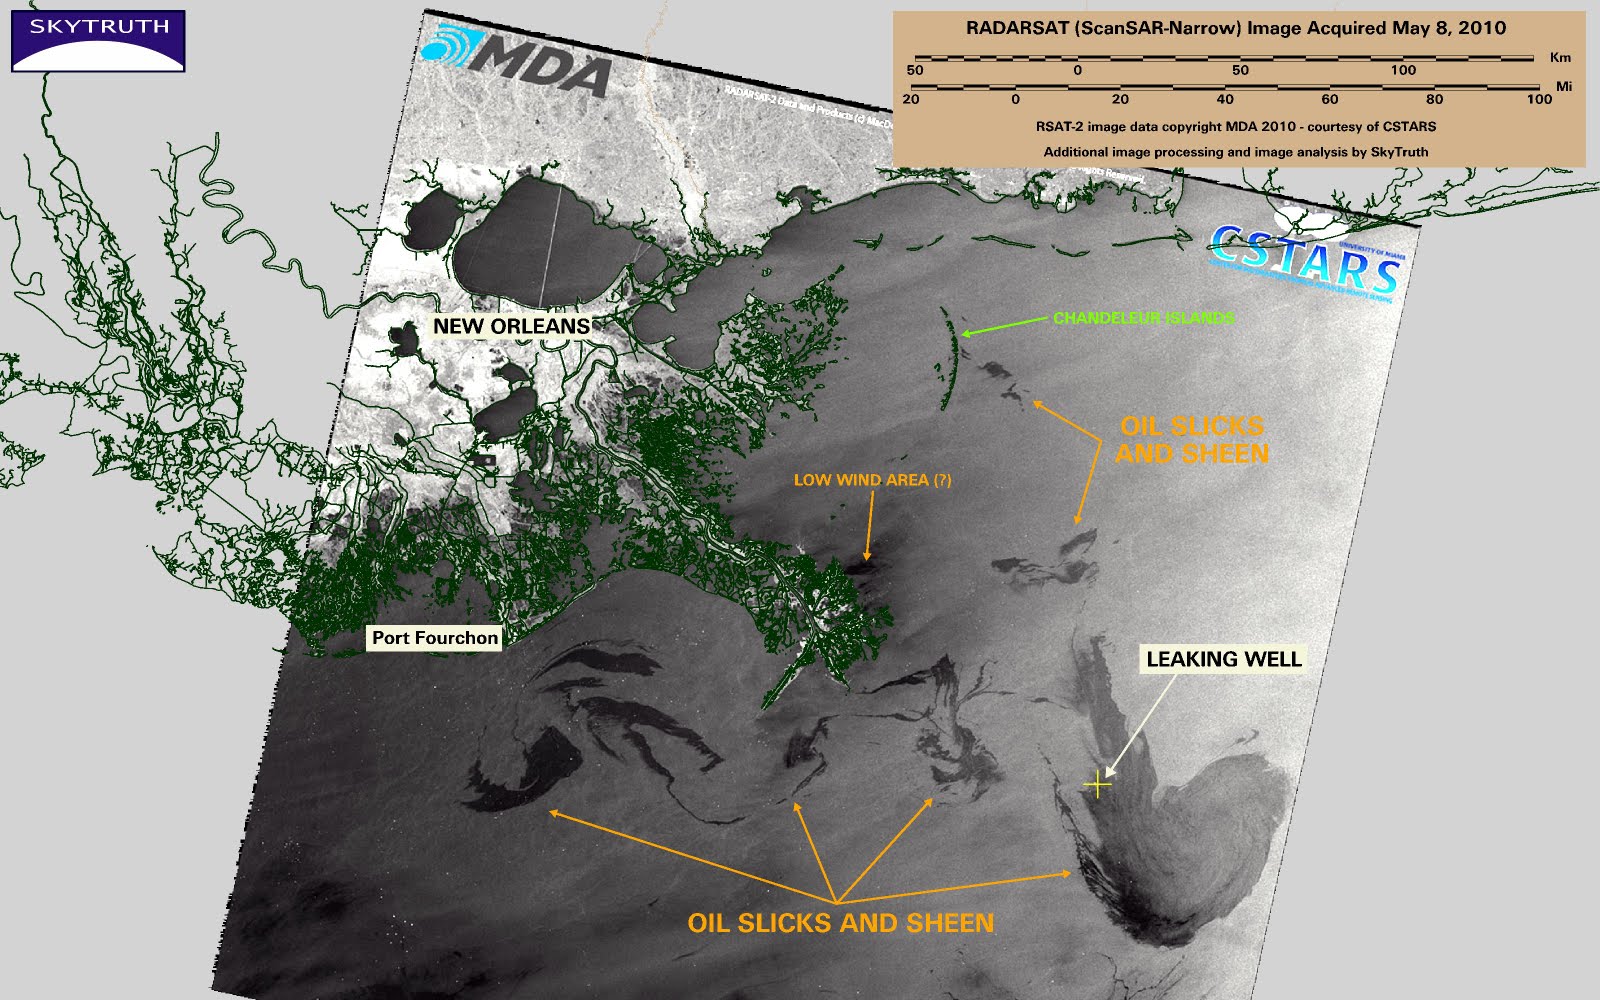
RADARSAT-2 image with SkyTruth analysis, May 8, 2010.
UPDATE 5/8/10 7:00 pm – The first attempt to place a 70-ton containment box over the main leak failed today; the box has been moved aside and is being troubleshooted, and tar balls have begun to wash up in Alabama. The leak is continuing unabated, at a rate we calculate to be about 1.1 million gallons (26,500 barrels) per day – five times higher than the last official estimate (5,000 barrels per day) the Coast Guard made, before they quit making estimates a few days ago, admitting they had no accurate way to estimate the spill rate.
We estimate more than 18 million gallons of oil have spilled so far.
Now we can do a heads-up comparison of the RADARSAT-2 image with this MODIS/Terra image taken about four hours later. Still some clouds obscuring portions of the slick; observable slick and sheen spans about 4,100 square miles (10,624 km2). Fresh oil is apparent around the location of the leaking well; it seems to be carried to the southeast, then gets caught up in a counterclockwise gyre in the currents:


Thanks for the update.
Without Skytruth pointing out an alternative view, the USCG expects us to assume a constant leak rate of 5,000 bpd.(like the 1,000 bpd assumption of base rate before your last analysis.
Thanks again John, for the great work. I don't think it needs to be said, but just to say it, you're a hero for many people, especially fishermen, in the gulf region. Keep up the rewarding work.
The image is interesting. But I keep coming back to the question of whether surface images reflect the spill. I'm sure you've read all that I have on this subject, and the most important article I think was that a controlled well's output was about 30K barrels per day.
I think the main question to answer (And this is not hard to answer.) is what did BP expect the controlled output of this well to be. I think we can say that it is probably above 30K barrels per day, since the cost of drilling this deep is much higher.
And when we think about what controlled output does, it manages the natural pressure from the well, so that the rig can deliver a constant flow to put aboard ships and get back to the refinery.
So if there are tar balls floating up in Alabama, obviously the underwater gulf currents are taking this spill beyond what Sky Truth can see.
The real truth is in the company estimates for this rig's production, as the images and tar balls show that may be a lot going on beyond the scope of SkyTruth's satellites.
My constructive criticism of your great work is that there is no grappling with this fact.
I suggest that, as a first step, you reach out to Robert Bea, among others and chat about what the oil is doing, and how much your surface estimates of the flow differ from the actual rupture.
This is not a criticism, but you, the oceanographers and Bea need to chat, because this particular well is at an unprecedented level of depth on the seafloor and below the seafloor. I don't think that BP would be leasing the DeepWater Horizon at $500K per day to get an average 30K output from this well. Think about that.
This slick is moving ever closer to the gulf loop which can carry the oil out of the gulf of mexico, potentially saving that GOM ecosystem, but sending it to the Atlantic coast. This is a bit ironic for the Atlantic coast, as most, if not all of the oil produced in the Eastern Gulf, is to meet the fuel needs of those in the Miami to Boston corridor.
Pipeline map http://www.theodora.com/pipelines/north_america_oil_gas_and_products_pipelines.html
John and Jay – thanks for the comments. Actually, the Coast Guard stopped estimating the rate of leakage from the well way back on May 1, with Admiral Thad Allen stating "Any exact estimate is probably impossible at this time" – so we stand by our most recent estimate (published here on May 1) of 1.1 million gallons (26,500 barrels) per day.
Sadly, the media continues to repeat that far too low, never-justified 5,000 barrels per day estimate that the Coast Guard themselves stopped using a week ago.
At SkyTruth we are talking with the oceanographers. That's why our estimate is so much larger. But we try hard to stick with what we know, and not speculate on what we can't see.