BP / Gulf Oil Spill – 39 Million Gallons And Growing
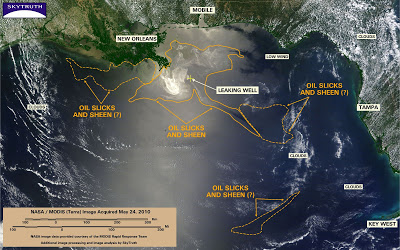
The MODIS / Terra satellite image of the Gulf taken yesterday (May 24, 2010) is a relatively cloud-free look at the ongoing oil spill in the eastern Gulf of Mexico. Areas covered by oil slick and sheen are marked with a solid orange line. Areas where we think there may be slicks and sheen, but our analysis is of lower confidence, are shown by dashed orange lines. All together, slicks and sheen are possibly covering as much as 28,958 square miles (75,000 km2). That’s an area as big as the state of South Carolina:

MODIS / Terra image, May 24, 2010, with SkyTruth analysis
We also though it would be interesting to produce a matching version of this image with none of our annoying annotation:

MODIS / Terra image, May 24, 2010, with no analysis or annotation
It’s Day 35 of this fatal incident. Our estimated spill rate of 1.1 million gallons (26,500 barrels) per day, now on the conservative end of the scientific estimates, leads us to conclude that almost 39 million gallons of oil have spilled into the Gulf so far. BP and the federal government had said that they would announce a new official estimate of the daily spill rate on May 22, but we’ve heard nothing more about that. As far as we can tell, they are still claiming the spill rate is 210,000 gallons (5,000 barrels) per day. At that much lower rate, the total amount spilled would be 7.35 million gallons.


are the calculations that were made based on photographs of slick being re-made as new data comes in? is the slick growth rate predicted, or predictable? does new evidence corraborate?
i suppose there are some folks who have very close and detailed pics of this 'event' – i wonder how long before they become public?
Monte – any calculations we would make now from the slick size as seen in the latest images would significantly underestimate the average daily spill rate: BP reports that millions of gallons of oil/water have been scooped up since the spill began; more has been burned off, or driven underwater by the spraying of several hundred thousand gallons of dispersants; and natural processes (wind/wave action, biodegradation, evaporation, ultraviolet degradation) have continually broken down the oil.
John, I have been following your information from the beginning. Thank you.
I am trying to stay as reasonable as I can with this disaster.
I have also been very aware of worst case scenarios.(so far ,so bad!)
I know that you are not a medical dr. but we already have La. Air Quality posting moderate days for elderly etc…due to toxins and I have a 10 y.o. immunosuppressed son.
I live on Lake Pontchartrain. Without fear, should I be cautiously looking to move him away from the coast, at this point??!!
Sitting here watching as the worst case scenario unfolds does not seem like the best choice….but I do not know enough about the science behind this.
Thank You for ANY feedback.
Edie – I am so sorry you're in such a tough position, as are many living in the Gulf region. I don't know what would be the best for you and your son, so please check with your family doctor or local health clinic. You might also try your local congressman's office to see if they can help you get the information you need. That's part of their job. I wish you and your son the best.
There is a critical need for funding to collect independent sea truth data on the blowout/spill. While Skytruth is doing a stellar job with the satellite imagery, surface data is necessary to provide calibration and sea truth data to make the satellite data really perform. The cost of obtaining this sea truth data is certainly not major. A modest set of instruments, an HPLC system set up on a modest boat, say my 50ft ketch, would easily be able to provide scores of sample data sets per day. I'd venture that ~$20,000 worth of hardware and another ~$20,000 per month of operating costs would easily keep such a vessel and effort at sea for ~20 days per month. Sampling the waters of the loop current suspect "slicks and sheen" could be done in a few days of effort. Such an effort could be ready to set to sea with a weeks notice. Anyone willing to chip in? nainoa1@gmail.com
Nainoa, is there a source of more official information for your effort than a comment on a blog?
Jon
Is there any possibility of releasing KML of your your markup or at least a the lat/long coordinates of the markup.
As you are well aware NOAA and USCG reported data of the size and extent of the slick is much smaller than what can be viewed in the satellite images.
For example, CNN reported that NOAA stated the surface area went from 10,000 sq miles a few days ago to now 1,000 sq miles. Your your analysis here has the size at almost 30,000 sq miles.
The Google version of the "Compare the slick to your city" unfortunately uses the that NOAA provided version.
I would like to keep my version of that app updated with real accurate data.
Thanks.
Alex
ABC News video clip of shallow below surface oil plumes:
http://www.huffingtonpost.com/2010/05/25/abc-news-goes-underwater_n_588555.html
Westexas – thanks for the link to that troubling video.
Alex – email us directly (info@skytruth.org) and I'll see what we can do. The last update on oil slick extent from NOAA was back on May 22. It seems they are only publishing forecast maps now. I don't understand that. Maps showing the actual extent and location of the slicks are critically important.
I am extremely impressed with your estimate of 26,000 bpd given the recently released estimates from our FRTG team, you nailed it almost a month ago. (http://www.deepwaterhorizonresponse.com/go/doc/2931/569235/)
Thank you for being a voice of reason. I am saddened by the "5000 bpd" charade that played out for all these weeks.
John-you guys are a godsend. Today's Modis/Aqua looks like there's been some significant movement to the east or am I just seeing things??? The Pinellas/Pasco GulfCoast await your wisdom because we're organizing now and not waiting for BP…..it'll be okay….drink the koolaid….it's BPLicious!!!!Thanks again John and ya'll at SkyTruth for helping us.
You are missing the dispersant treated oil which is far more extensive than the areas outlined on your map.
Treated water is neither slick or shiney.
Metalious – that is entirely possible – we can't see oil that is deep under the surface,
Okidoki – thanks. Today's Aqua image is a good one- we'll get that processed and analyzed tomorrow. But at first glance I don't see signs of a significant move.
Petrea – thank you too. We stuck to what we could directly observe. As Metalious points out, we are not including the unknown quantity of oil that may be lingering beneath the surface, so we still think our 1.1 million gallon per day estimate is very conservative.
I understand hair absorbs oil. Each county in the US has a Local Emergency Planning Committee (LEPC). It would seem useful to have the BHS coordinator in every state mobilize every LEPC in the state to begin a hair recovery campaign involving the collection of hair from salons and groomers, ship to a state collection site and then ship to a sit in Louisiana for the building of boom. We spend a lot of money on this preparedness effort – it would be good to see our investment payoff in this disaster.
here is a link to a very interesting site – folk maping the spill with kites and balloons
http://www.grassrootsmapping.org
Monte – thanks for the link – that grassroots mapping initiative is fantastic. We're hearing reports from official sources of what seems like an unrealistically small area of oil-impacted marshes and wetlands (30 acres, according to one official yesterday) – we hope the folks at grassrootsmapping can help us provide imagery to either verify or refute that.
Received via email from lwjewett 5/28/10:
—
John, you are entirely correct.
I found the attached NASA graphic of the "Sea Surface velocity" that was taken may 23, just a couple days after the image that you analyzed on may 21 and it looks like what you identified as the loop current DOES match up very well with the south-directed part of the velocity field shown on the sea velocity graphic.
It looks (from eyeballing it) like the northward velocity field starts just below that (just out of the image you used) and a little west of that.
By the way, I noticed your surface analysis number (1.1 million gallons a day) has been again validated by the analysis by the team of scientists put together to come up with a "better" flow number — better than Coast guard number, anyway! (Were you and Ian MacDonald involved in that?)
Not really a surprise. particularly that it was significantly higher than what Coast Guard — and BP — have claimed. BP obviously has a vested interest in low balling the magnitude of the disaster to minimize their liability.
I do wonder whether the newest range (between about 2 and 5 times the "official" 5000 barrel estimate) STILL might be a low-ball estimate though.
I don't really know anything about how the latest analysis was performed to know how reliable it is.
It's my feeling, however, that ANY estimate based on an analysis of the videos contains a large uncertainty because of the issue of gas vs oil. You can probably decrease that some by gray scale analysis of the images over some time period, but I'd guess that is probably still very uncertain, because the oil and gas is all mixed together AND you are seeing only the surface of the flow and from only a single perspective.
As you and Dr. MacDonald have indicated, the number obtained from an analysis of surface slicks is very likely conservative. That's my hunch as well. You did not give error bars on that, but I'd bet that it's not a symmetric distribution (larger on the high side).
We actually KNOW (from discovery o f large oil plumes, etc) that there is a lot of oil that has not reached (or stayed on) the surface, since BP has been using dispersant literally like it is going out of style (it was outlawed in the UK and I'd bet they are trying to dump their inventory)
Of course, a lot of the guestimating about the actual flow could have been minimized if proper instrumentation had been put in place soon after the blowout. But BP obviously did not want that and it looks like they have basically been calling the shots — notwithstanding a recent very prominent claim to the contrary 🙂
Keep up the great work.
L Jewett
Despite my initial cynicism, you and Ian MacDonald have managed to FORCE a measure of transparency onto this whole sad affair.
Please note: message attached
L Jewett – thanks for this info and May 23 sea-surface height map from NASA that helps define the location of the Loop Current (could you pass along the URL linking to those maps?).
Dr. MacDonald and I were not part of the Flow Rate Technical Group (FRTG) that came up with the latest official government estimates of the spill rate (500,000 to 1,000,000 gallons per day).
This is for Michael who just posted at 10:30am.
Hair is an excellent oil absorber, but even though we have volunteers here on the GulfCoast furiously working to create hair-booms….get this: The Coast Guard says they won't use them.
"Coast Guard may not want hair booms, but Holiday woman keeps working"
http://www.tampabay.com/news/environment/water/coast-guard-may-not-want-hair-booms-but-holiday-woman-keeps-working/1097657
The latest reports from BP and the Top Kill effort state that less than 10% of the mud is being retained in the stack. Whatever amount of mud being pumped into the flow, it was calculated by qualified engineers to be likely sufficient to staunch the flow of oil and gas at some assumed rate. Let's assume the BP engineers are total rubes and they were using the low ball leak flow of 12,000-19,000 bbls per day. Their prescribed counter force is off by a factor of ten! This failure of the Top Kill offers very good experimental data showing the leak rate is vastly higher than what was being used.