Fishing The Line: Do Marine Reserves Improve Fishing?

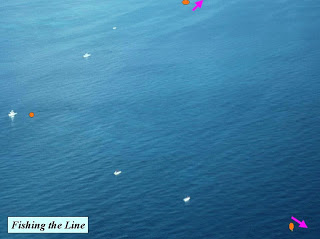
Low-altitude air photo showing small boats “fishing the line” on the border of a protected area that is off-limits to fishing. Photo courtesy of Billy Causey, Florida Keys National Marine Sanctuary.
Here’s a blast from the past: a recap of one of the first projects SkyTruth ever conducted, a limited study of satellite imagery as a tool to demonstrate “fishing the line.” There is abundant anecdotal information that when an area of the ocean is closed to fishing, fish populations rebound and “spill over” into adjacent areas outside of the protected zone. Fishermen, who go wherever the most fish can be found, take advantage of spillover by fishing as close to the boundaries of the protected area as possible — fishing the line. Wherever we see an accumulation of fishing vessels close to the borders of a marine reserve or other area off-limits to fishing, conservationists argue that the fishermen themselves are demonstrating that the protected zone is doing a good job at increasing fish populations and improving the fishing opportunity.
But how do you actually go about showing this “fishing-the-line” phenomenon?
One way is to collect data on the locations of fishing vessels. The U.S. Coast Guard does this for certain fishing grounds, requiring all vessels to have a transponder on board that continually broadcasts data on the vessel’s position. This is called the Vessel Monitoring System (VMS). SkyTruth acquired VMS data for scallop fishing in the northwest Atlantic ocean, in the vicinity of George’s Bank off Cape Cod, Massachusetts. The aggregated data, plotted on a map that includes the boundaries of three areas that were closed to scallop fishing at that time, clearly showed vessels avoiding (or simply transiting through) those closed areas, and spending a lot of their fishing time congregated along the borders of those closed areas.

Aggregated VMS data showing fishing-vessel locations (colored points) and areas closed to fishing (blue polygons) in the northwest Atlantic Ocean in May, 1999.
We used this pattern to guide an analysis of archived satellite imagery to test whether fishing-the-line behavior could also be detected, and illustrated, using satellite images as the sole source of data on vessel locations. Thanks to a small research grant from American Oceans Campaign (now Oceana), SkyTruth was able to purchase, process and analyze three Radarsat satellite images taken in March and May of 1998, while the closure of Area 1 was in effect. Vessels typically appear on radar satellite images as very bright targets.

RADARSAT-1 satelite images used in this study.
The combined locations of vessels on the images was plotted on the map shown below. Although the pattern isn’t as obvious as in the VMS dataset (we were not able in this limited study to discriminate between fishing vessels and the many other types of vessel that transit the north Atlantic), possible fishing-the-line is apparent, particularly along the western boundary of the closed area.

Vessel locations in and around an area closed to fishing off Cape Cod. Compiled by SkyTruth from radar satellite images.
As fisheries around the world struggle, many scientists claim that establishing more protected areas can be an effective tool to help those fisheries recover and move toward sustainability. With a little more work by SkyTruth, we may find that satellite images can help convince skeptical fisherman and managers to embrace protected areas.


We experience a lot of productive fishing along the edges of protected zones along the South African coast. Fishermen who venture into these protected areas have phenomenal catches. This is proof that the protection here does lead to increased fish stocks in and around those protected areas.
Charl
Extreme Nature Tours